

A task says "Queued" (Kubernetes)
The workspace’s quota is full. Look at “Workspace quotas” and wait for another pod to end, or raise OCTOPUS_TENANT_QUOTA_CPU_REQUESTS / _MEMORY_REQUESTS.
Infrastructure is the operator’s view of the machine Thulu runs on: how much CPU, memory and disk is left, which containers (or pods, on Kubernetes) are running and for which workspace, how many runs are waiting for a slot and how the sandboxes’ dependency cache is doing. It answers “why won’t it start?” before you open a terminal on the server.
Only admins of the operator workspace, the one OCTOPUS_OPERATOR_WORKSPACE names on the daemon, can see it, because it shows every workspace in the installation. On an installation without login, whoever opens the dashboard sees it. On the SaaS version customers don’t see it; for their consumption they have Usage and costs.
Go to “Settings” (at the bottom of the sidebar) and, in the “Operations” group, pick “Infrastructure”. If the link doesn’t appear, you aren’t an admin of the operator workspace. The address is /infra/ and each tab has its own (/infra/#cache, /infra/#storage), so you can save or share the link to a specific tab.
The page refreshes itself every 5 seconds and says so at the top right (“Updated 8s ago”). If the browser tab is hidden, it shows “Paused while the tab is hidden”; if the daemon stops answering, it shows the last data with “Couldn’t refresh. Showing data from … ago.”. “Refresh” forces a read.
Look at the four numbers at the top, which stay visible on every tab: “CPU” (with the load and the threads), “Memory”, “Disk” (what’s free in the data directory) and “Agent runs” (how many are running and how many are waiting for a slot). The bar turns amber from 75% and red from 90%.
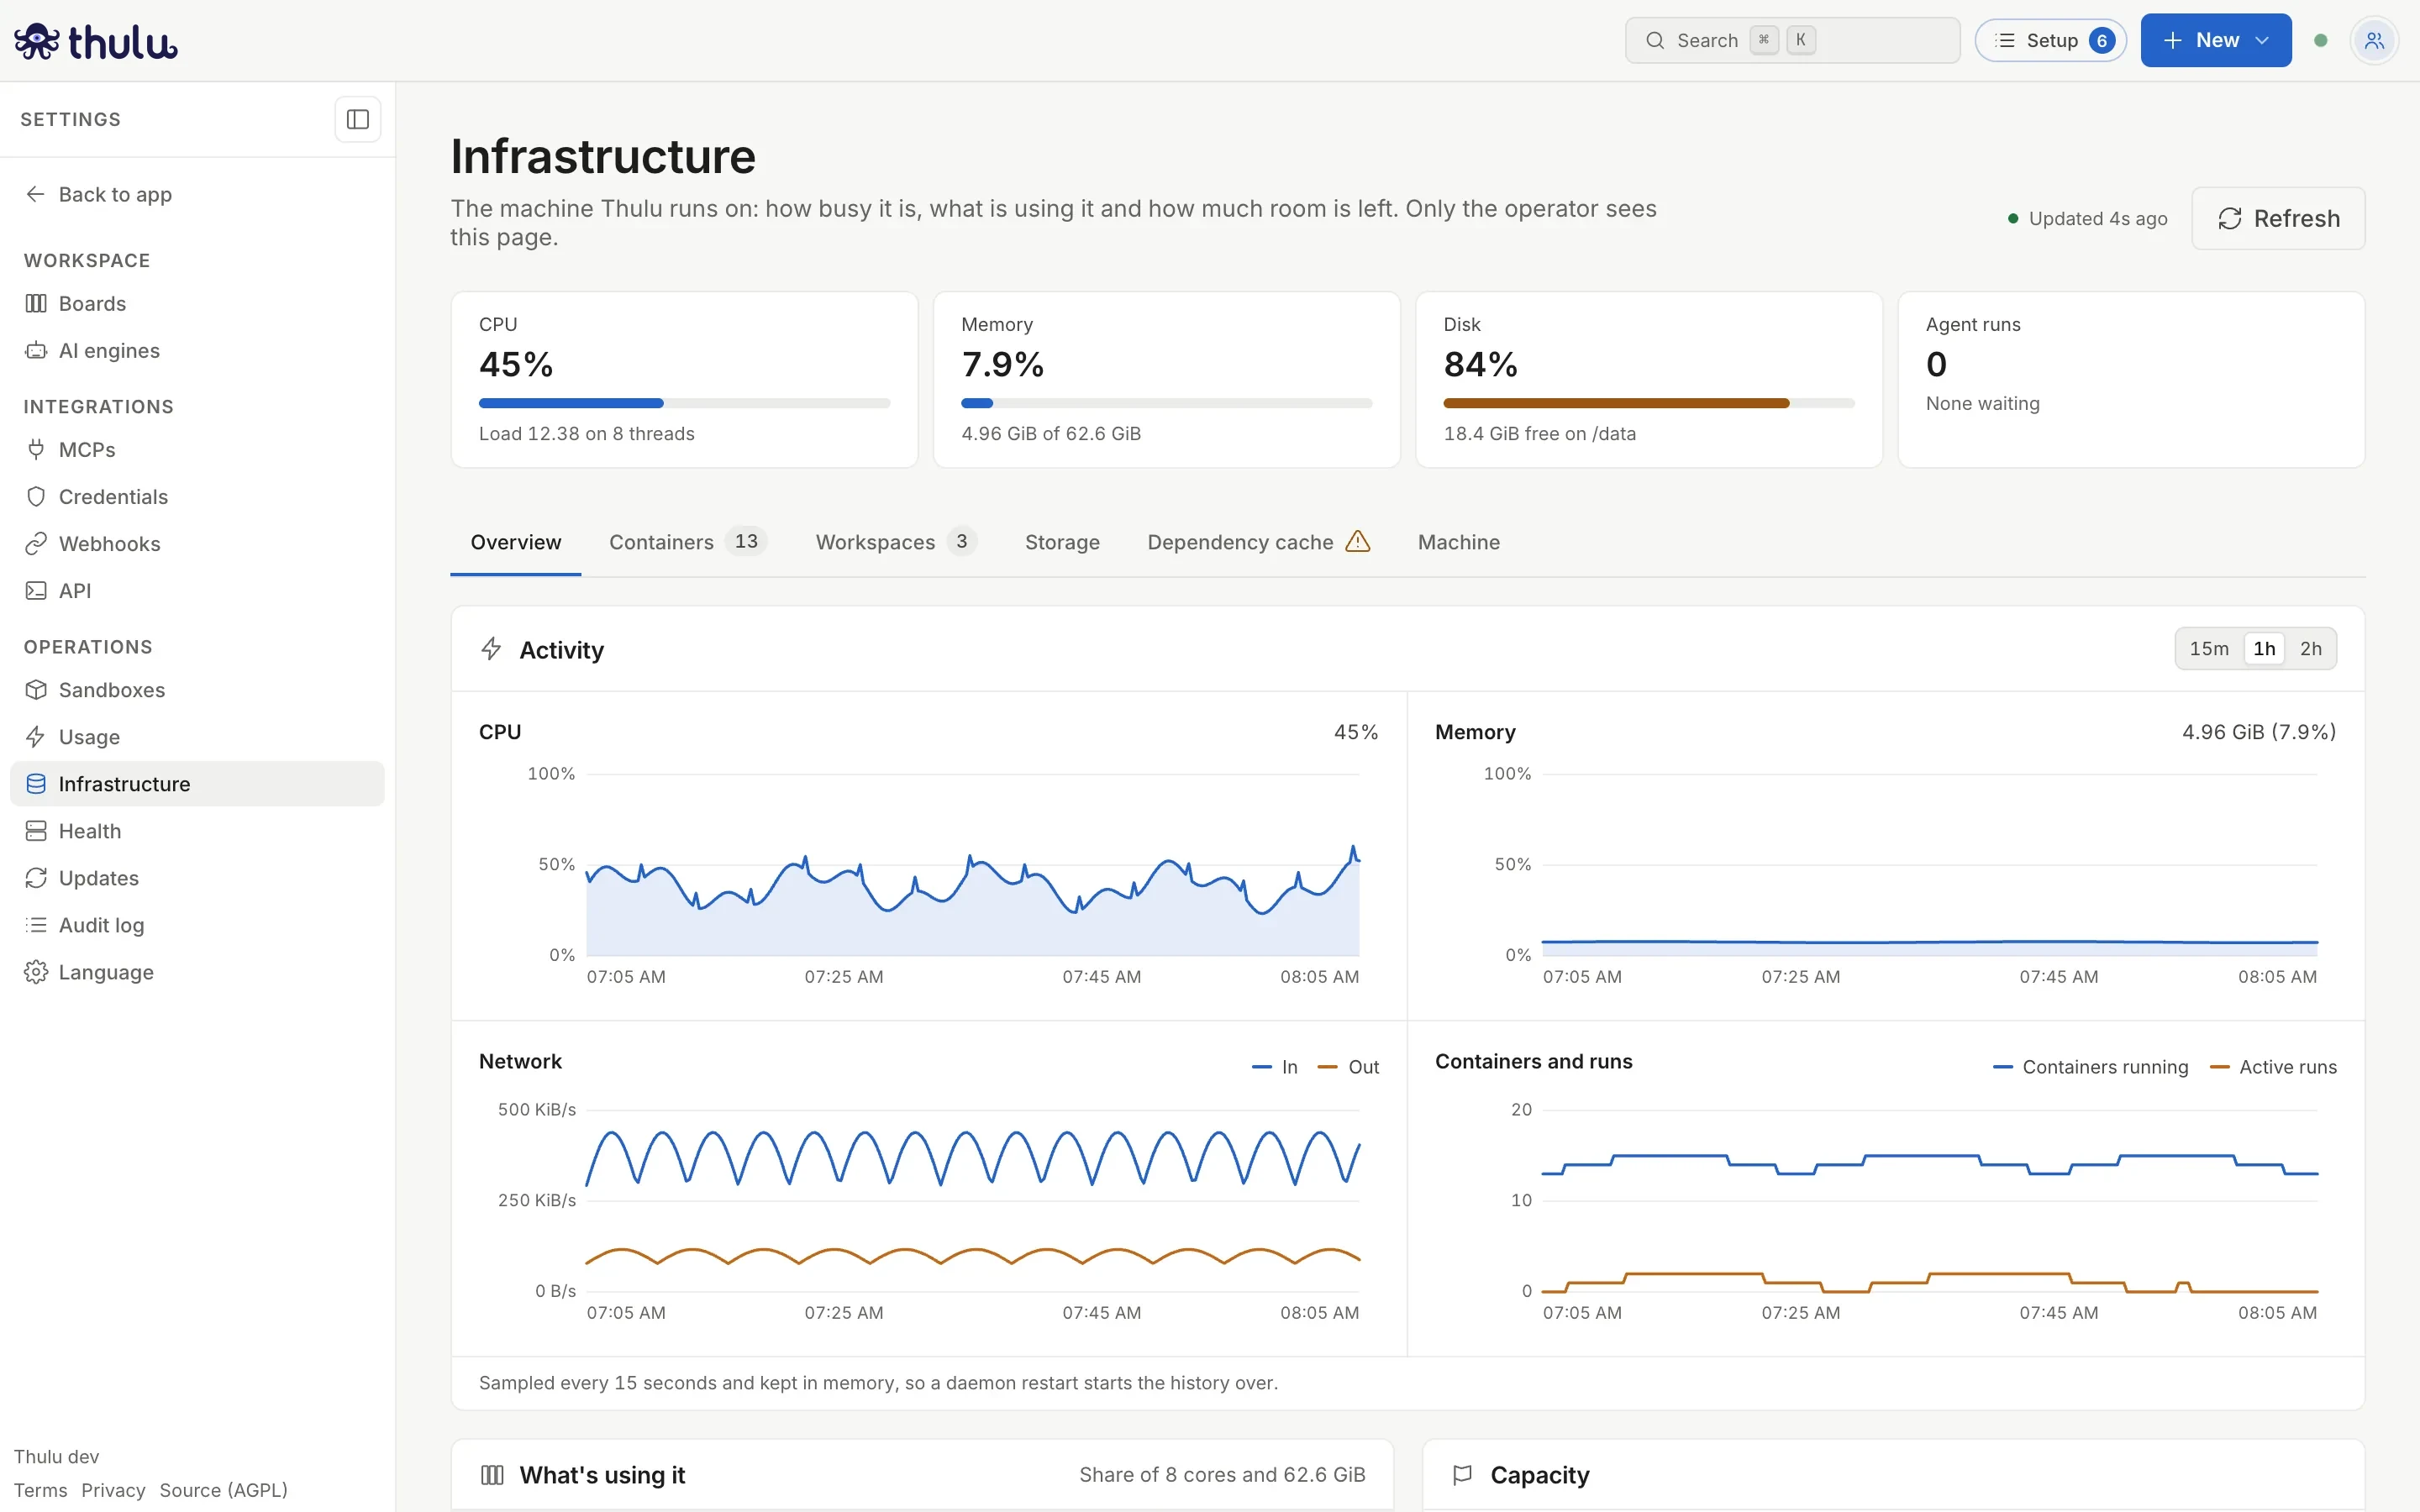
In “Overview”, the “Activity” panel charts CPU, memory, network and containers. Pick “15m”, “1h” or “2h”. The history lives in the daemon’s memory: after a restart it says “Showing the last 7 minutes, since the daemon started.”
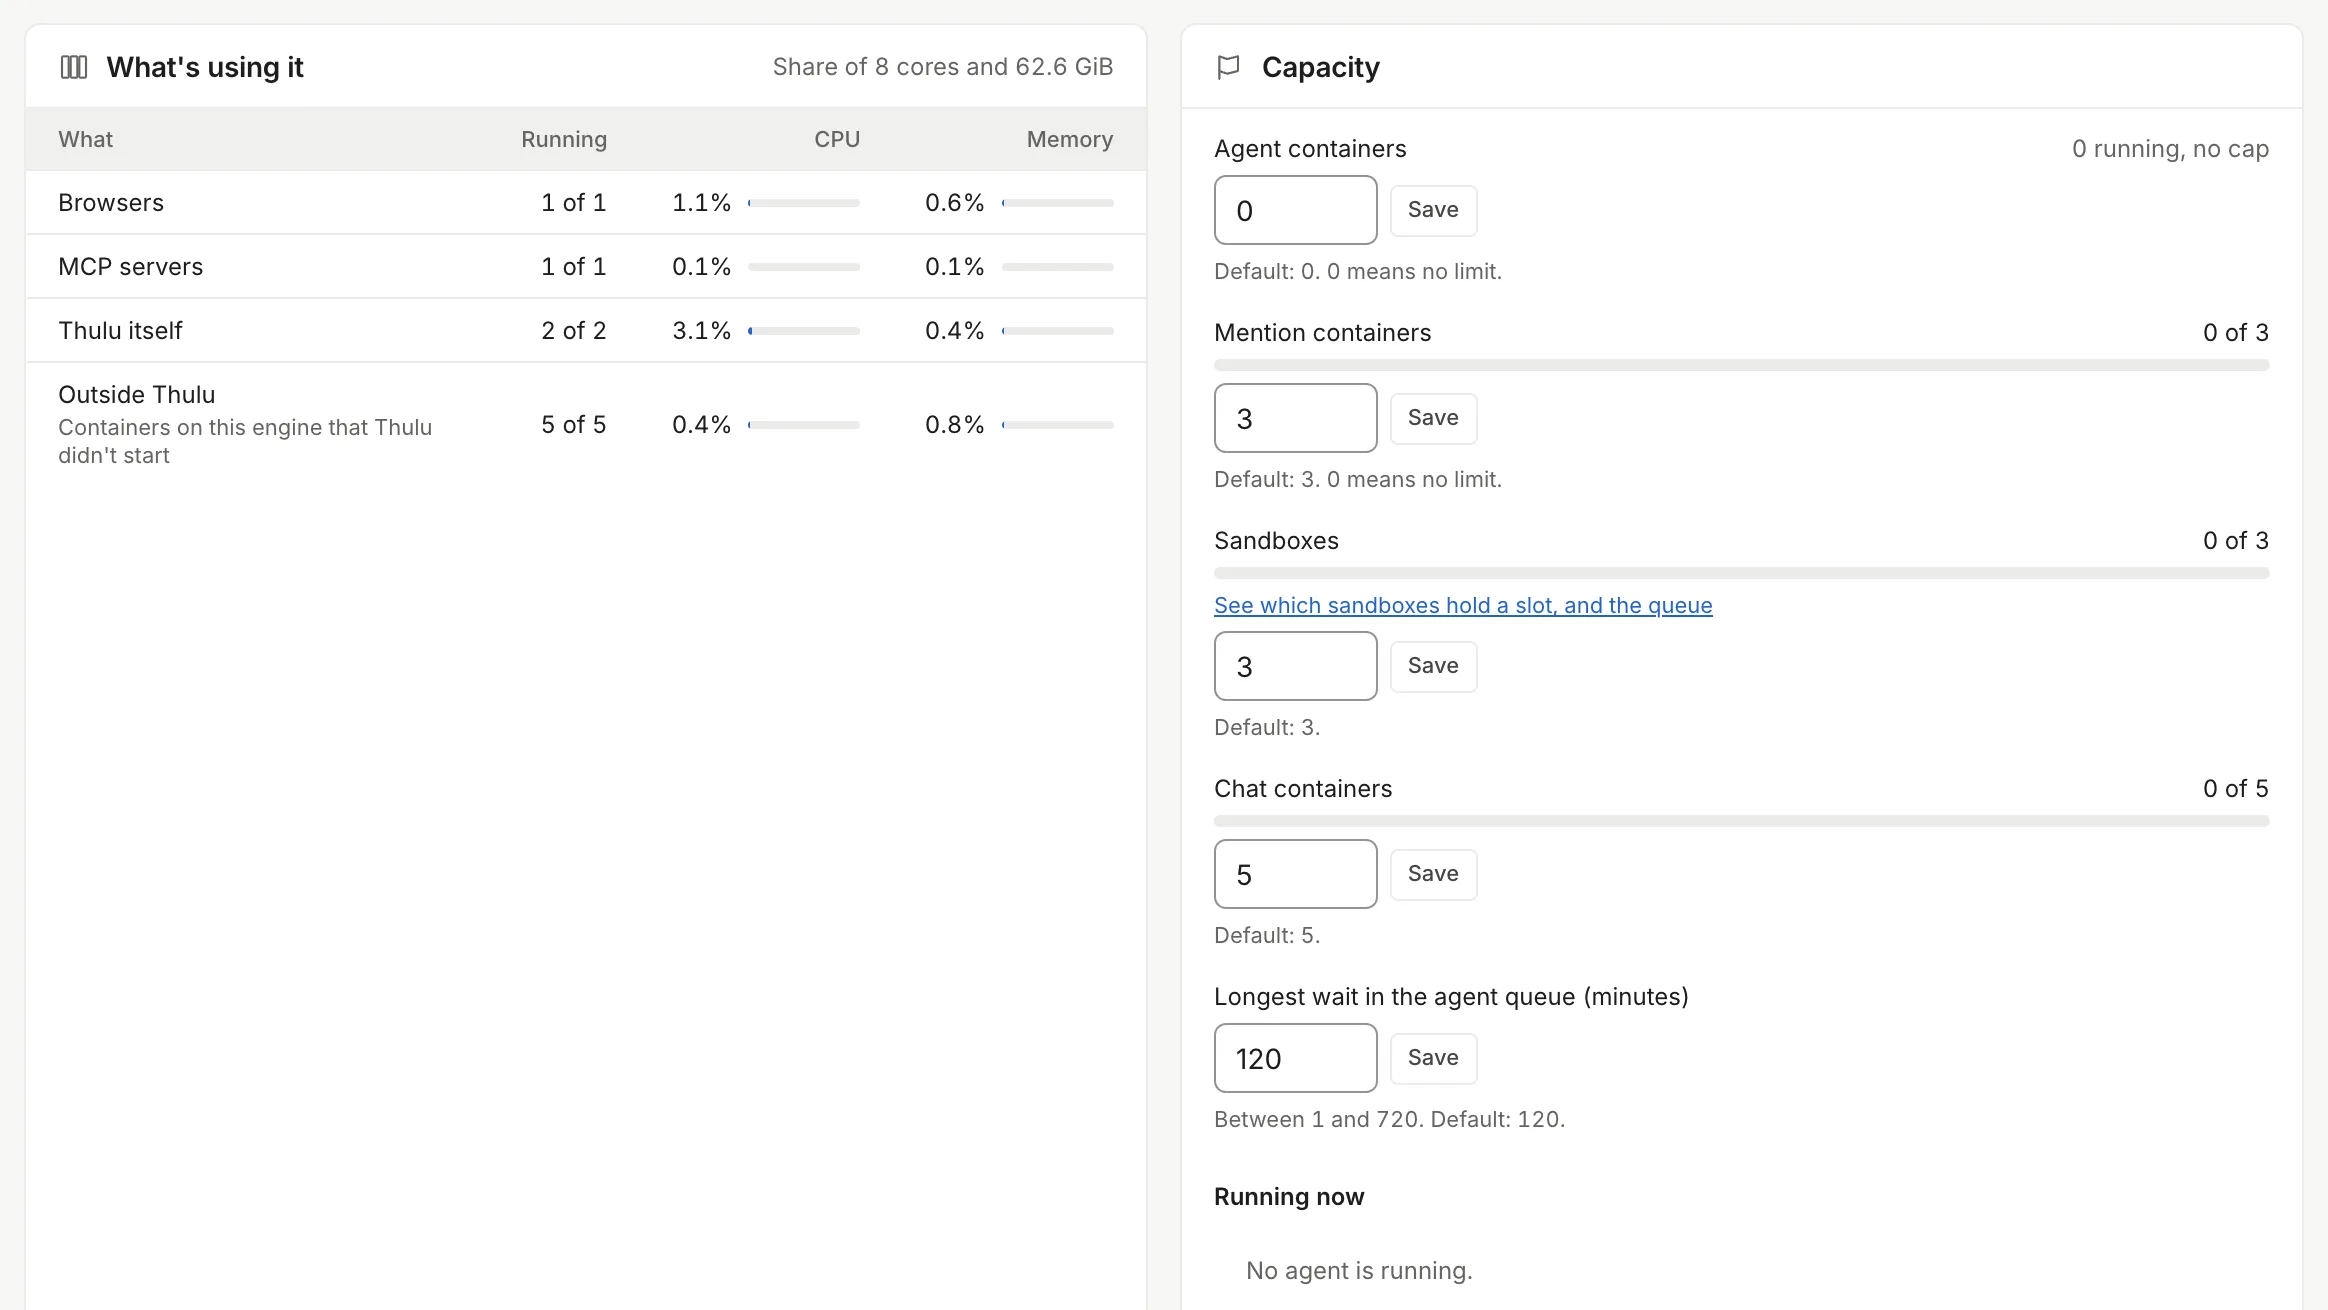
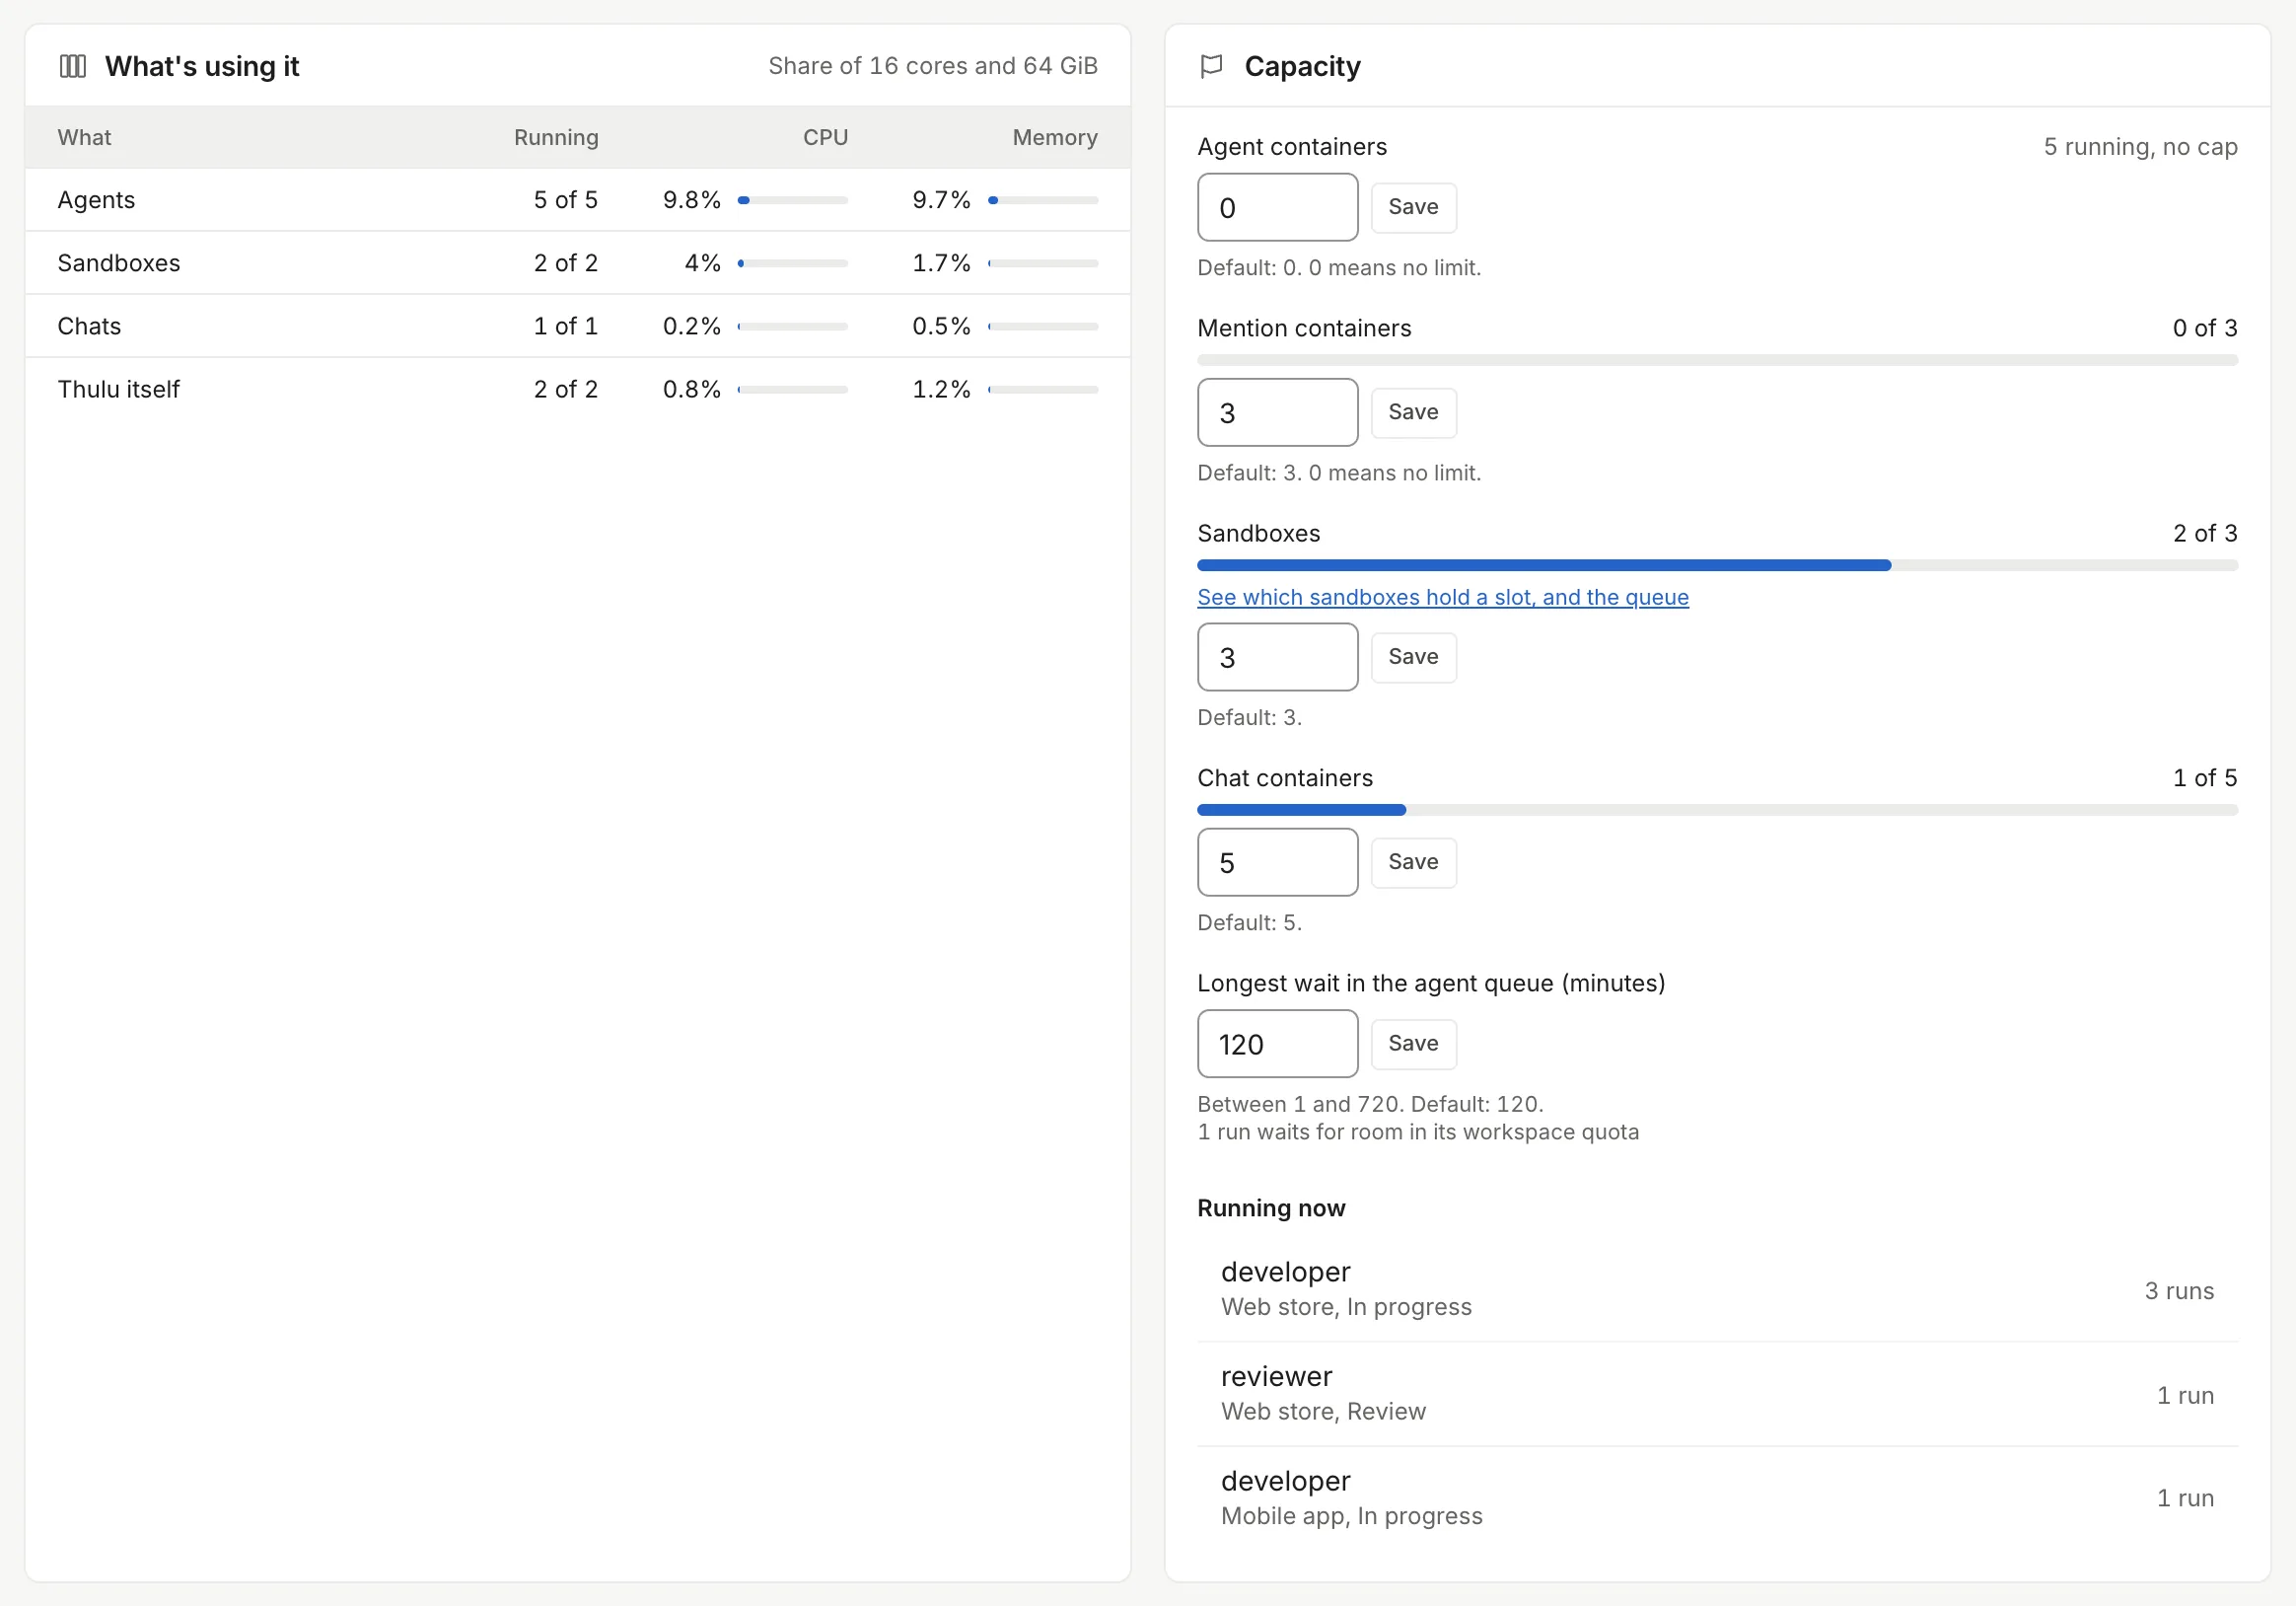
Further down, “What’s using it” splits CPU and memory by kind (agents, sandboxes, chats, browsers, MCP servers, Thulu itself, and “Outside Thulu” for whatever runs on the same engine without this installation having started it). “Capacity” compares what’s running against each limit, with a field to change it, and lists “Running now” by agent, workspace and stage.
If the four numbers look fine and a task still won’t start, the problem is usually in the task (credential, repo, agent): see Agent runs.
| Tab | What it shows | Why you open it |
|---|---|---|
| “Overview” | Activity, “What’s using it”, “Capacity” | See whether there is room and who is using it |
| “Containers” (or “Pods” on Kubernetes) | Each container with kind, workspace, agent and stage, CPU, memory, uptime and state | Find the one that’s consuming or the one that hung |
| “Workspaces” | Installation totals and one row per workspace; on Kubernetes, “Workspace quotas” | See which workspace is using the machine today and how much it spent |
| “Storage” | Disks, data directory by folder, Postgres and Docker storage | Know what’s filling the disk |
| “Dependency cache” | How sandbox installs turned out, by project and by workspace | See whether the cache hits or a script needs fixing |
| “Machine” | Host (system, CPU, memory, swap, network) and runtime (Docker or Kubernetes, nodes) | Server details without going in over SSH |
Open “Containers”. The number next to the tab name counts the ones that are running.
Filter with “All kinds” (Agents, Sandboxes, Chats, Browsers, MCP servers, Thulu itself, System, Outside Thulu) or search by name, workspace or task in “Name, workspace or task”. Uncheck “Running only” to see the stopped ones too.
The table comes sorted by CPU, highest first. Click “Memory” (or any other header) to sort by that column; a second click reverses the order. Under the percentage it shows how many cores it uses, or what share of its memory limit.
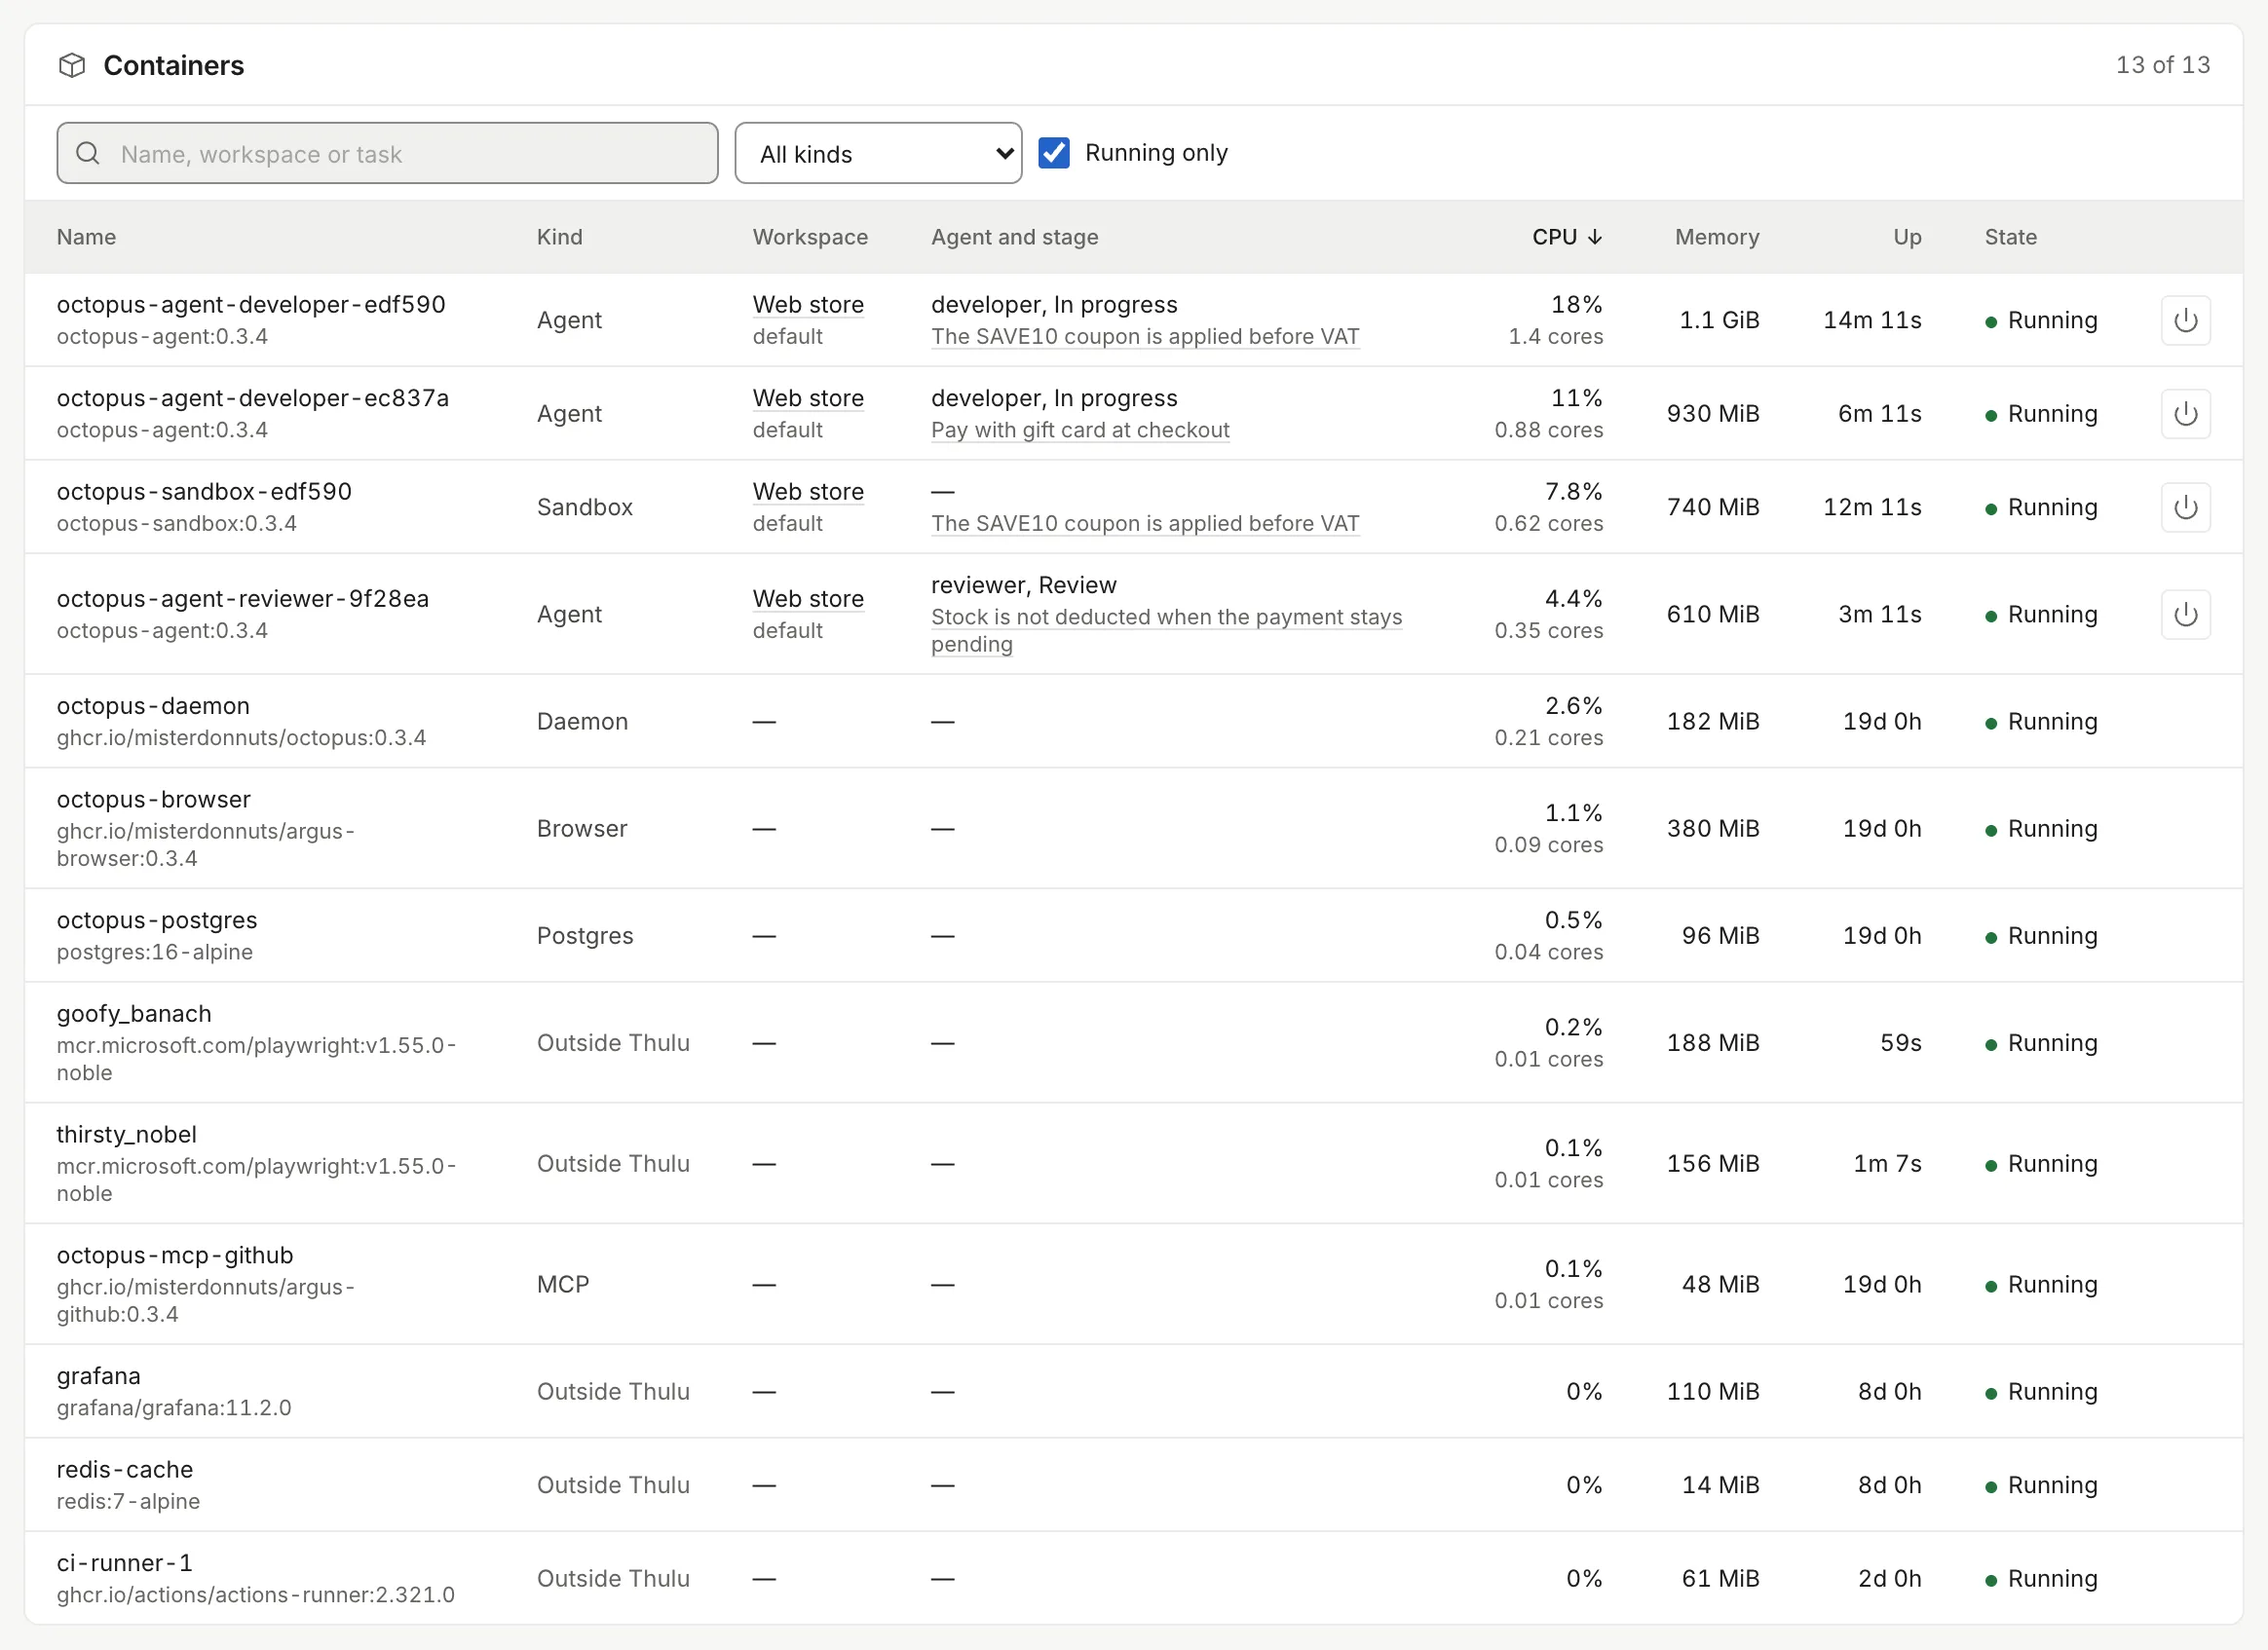
The task column leads to the task and the workspace column to the “Workspaces” tab. Agent, chat and sandbox containers have “Stop” at the end of the row. Stopping an agent leaves the run recorded as stopped by you and the task in its stage, ready to relaunch; stopping a chat doesn’t end the conversation: the next message starts a new container and resumes the session. An agent container that no run of the task launched is removed instead of stopped.
“Workspaces” opens with four totals (workspaces, users, projects, tasks) and continues with one row per workspace: plan, containers and agents running, CPU and memory, “Runs today”, “Disk”, “Tokens today” and “Cost today”. “Today” is the UTC day.
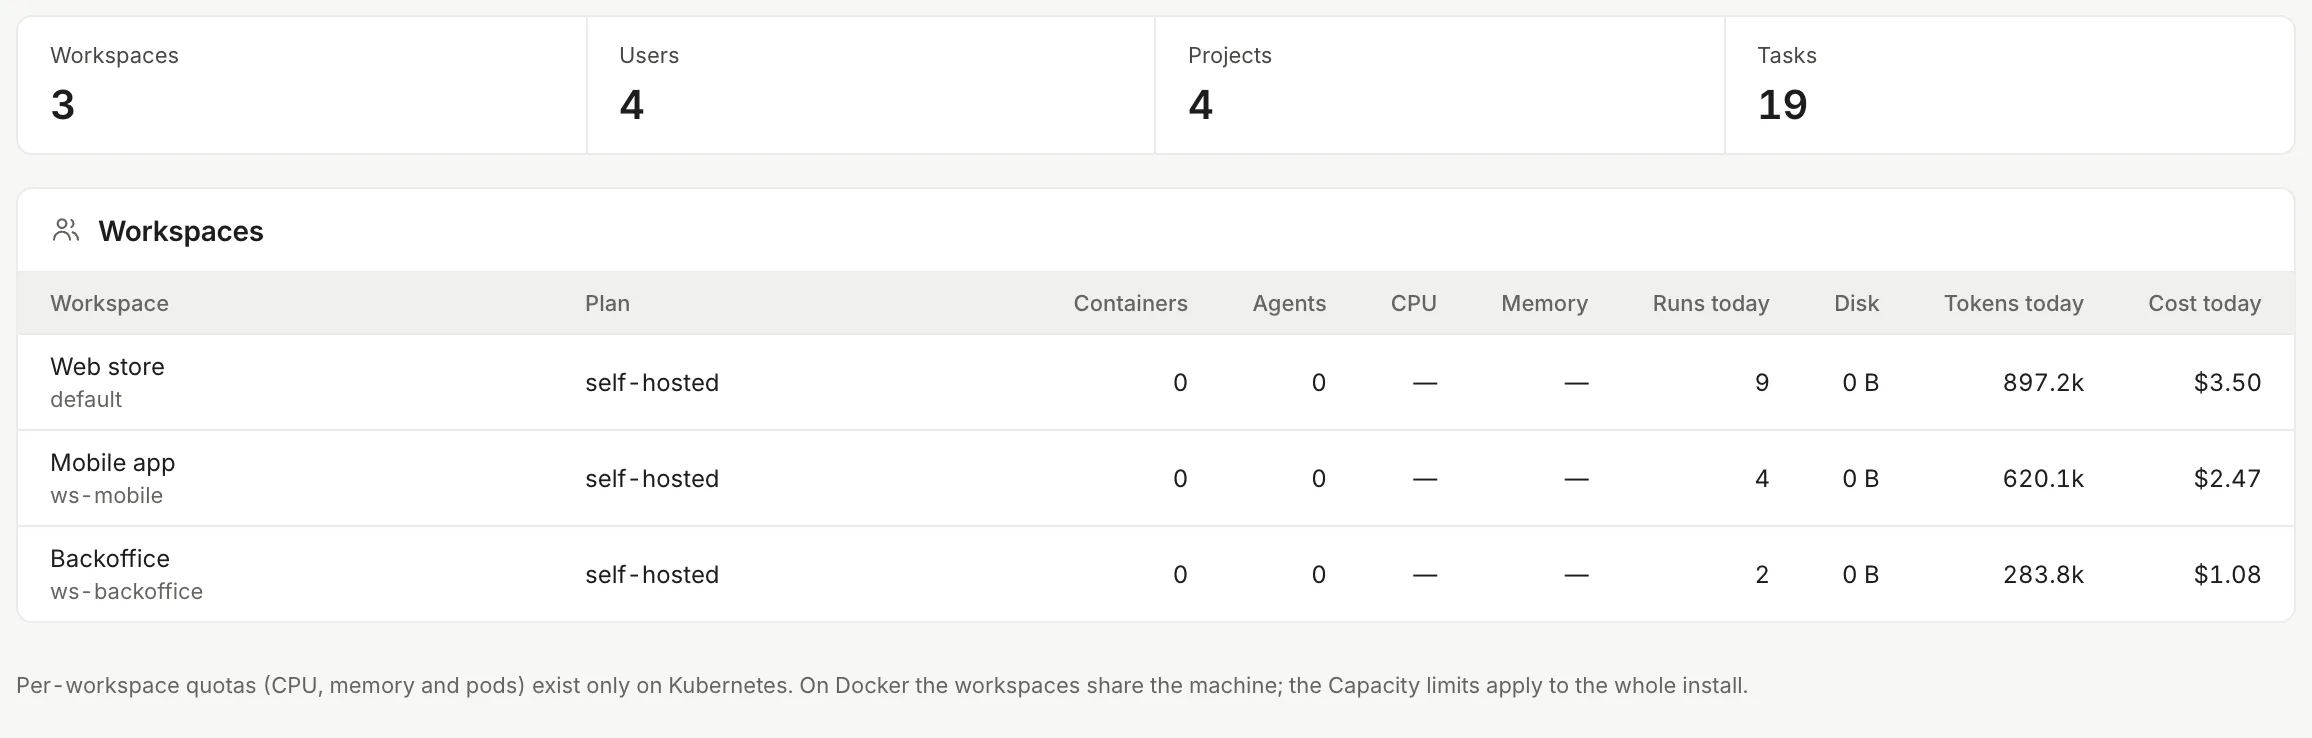
On Kubernetes, “Workspace quotas” also appears: for each workspace namespace, the CPU (in cores) and memory reserved against the quota, the ceiling below (“Ceiling …”) and the pods. It is the panel that explains a “Queued” task. On Docker, a line takes its place saying that per-workspace quotas exist only on Kubernetes and that the Capacity limits apply to the whole installation.
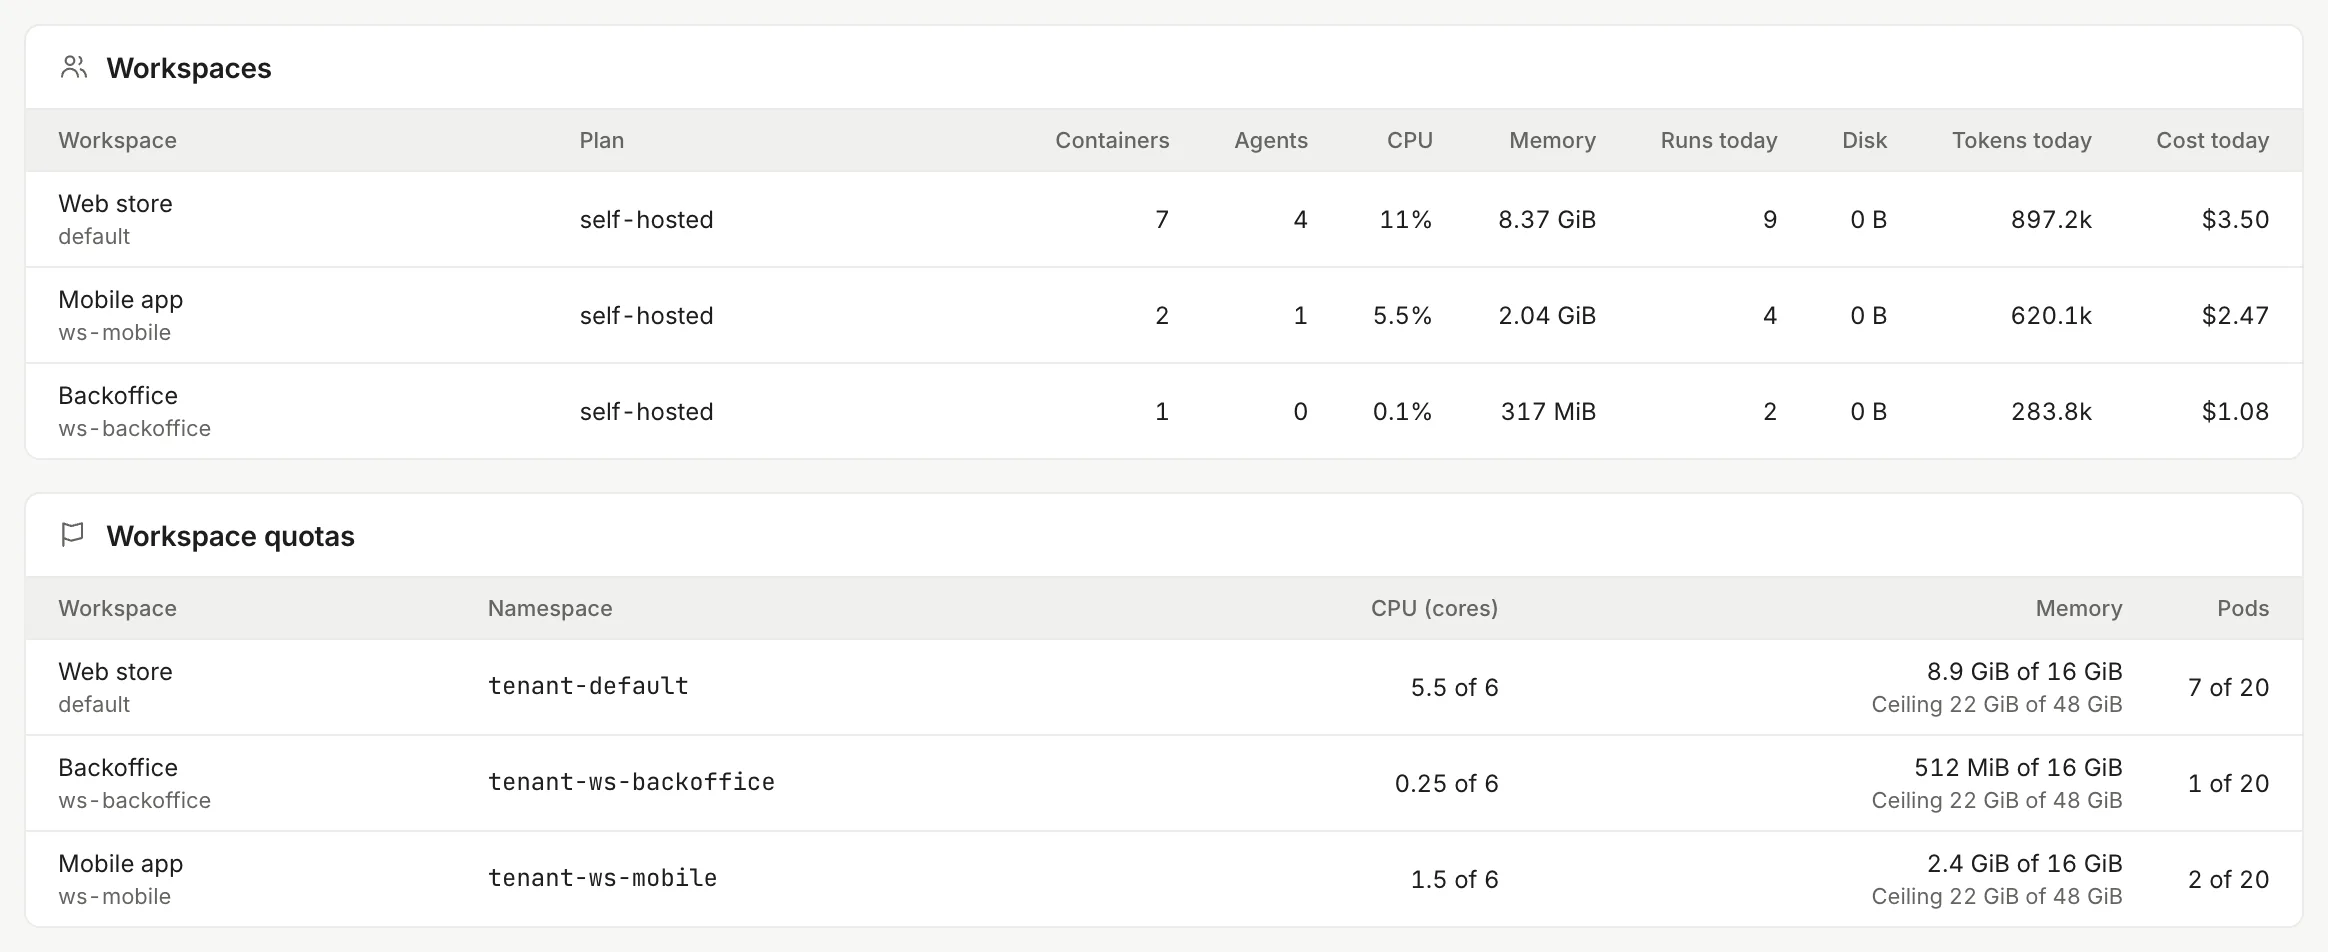
On Kubernetes each workspace has a resource quota. It counts what each pod reserves (the CPU and memory it requests), not its ceiling. With the default configuration, an agent with its browser reserves 1 CPU and 1.7 GiB, and a sandbox 0.5 CPU and 0.7 GiB. When the workspace’s quota has no room for a new pod, the run doesn’t fail: the task goes to “Queued” and waits its turn.
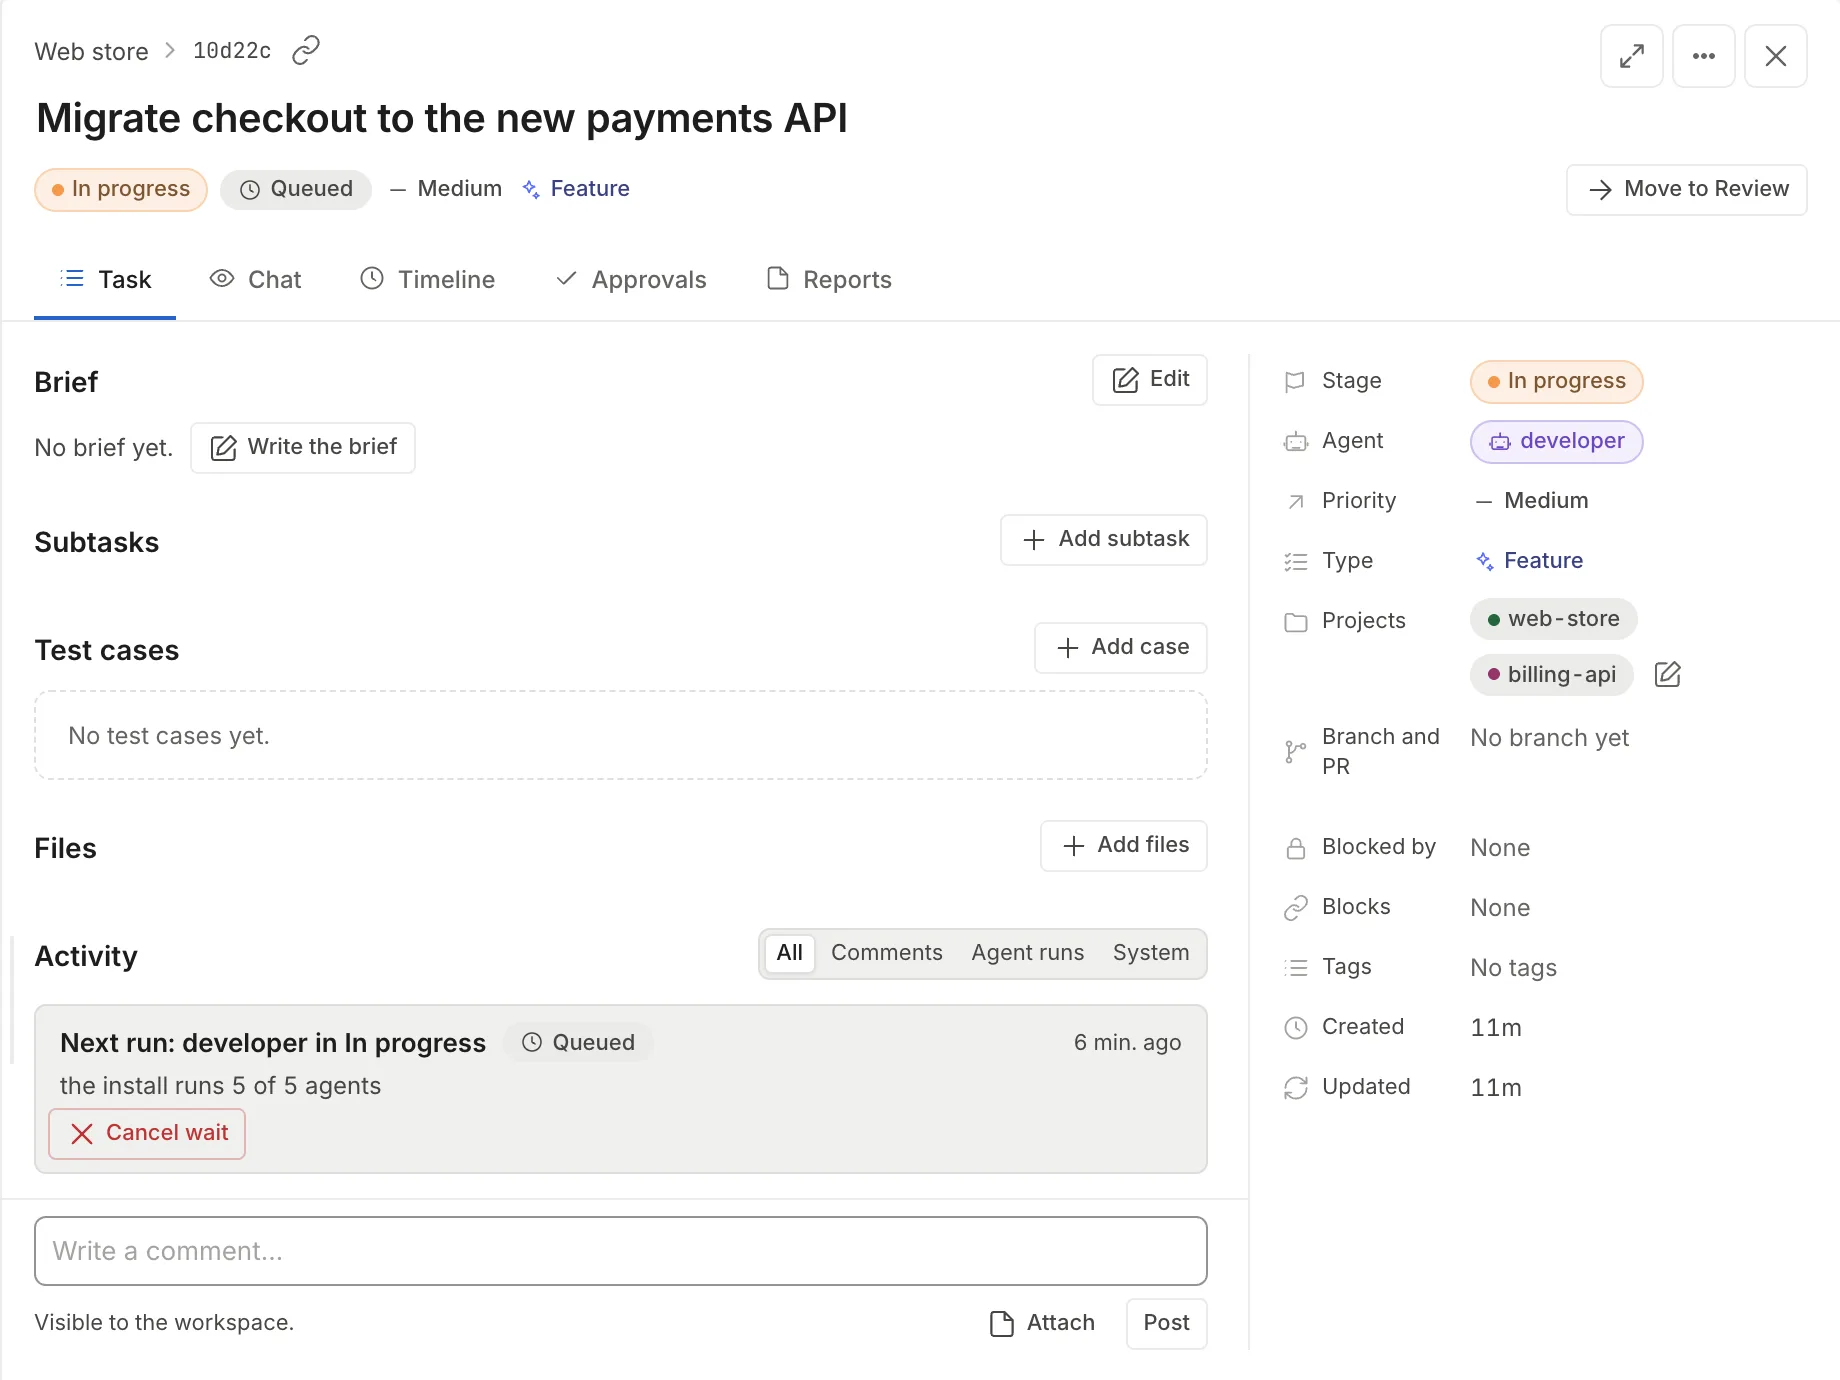
Open the task. Next to the stage it says “Queued”, and in “Activity” the “Next run” card appears, with the agent, the stage and the reason in words (“the workspace has 5.5 of 6 CPU reserved and needs 1 more”). If the reason didn’t arrive, it says “Waiting for room to start”. Thulu also leaves a system comment saying it will start on its own and after how many minutes it gives up. “Cancel wait” takes it out of the line without moving the task.
In Infrastructure, the “Agent runs” card adds up the ones waiting (“1 run waiting for a slot”) and “Capacity” adds “N runs wait for room in their workspace quota”.

In “Workspaces” > “Workspace quotas”, find the workspace and see which resource is full.
Wait, or free up room: when any pod of the workspace ends (another run, a chat, a sandbox), the first task in the line tries again right away. If that notice doesn’t arrive, it tries on its own every 5 to 30 seconds.
How the line behaves:
agent.max_queue_minutes, up to 720) it gives up: the task is left failed with the last rejection.On Docker there is no per-workspace quota: the brake is the installation’s agent cap (agent.max_containers, no cap by default) or the workspace plan’s. A run that doesn’t fit puts the task in “Queued” with the same card, the reason (“the installation is running 4 of 4 agents”) and “Cancel wait”. In Infrastructure it shows as “N runs waiting for a slot” under “Agent containers” and on the “Agent runs” card.
Each workspace has a persistent cache (npm, Go, pip and the tool versions mise installs) shared by all its sandboxes, and each project can have snapshots of its install built by the prewarm. This tab shows whether that works. How to configure the init script is in Sandbox.
Open “Dependency cache” and pick the range: “7d”, “30d” or “90d”. Data is kept for 90 days and refreshes every minute.
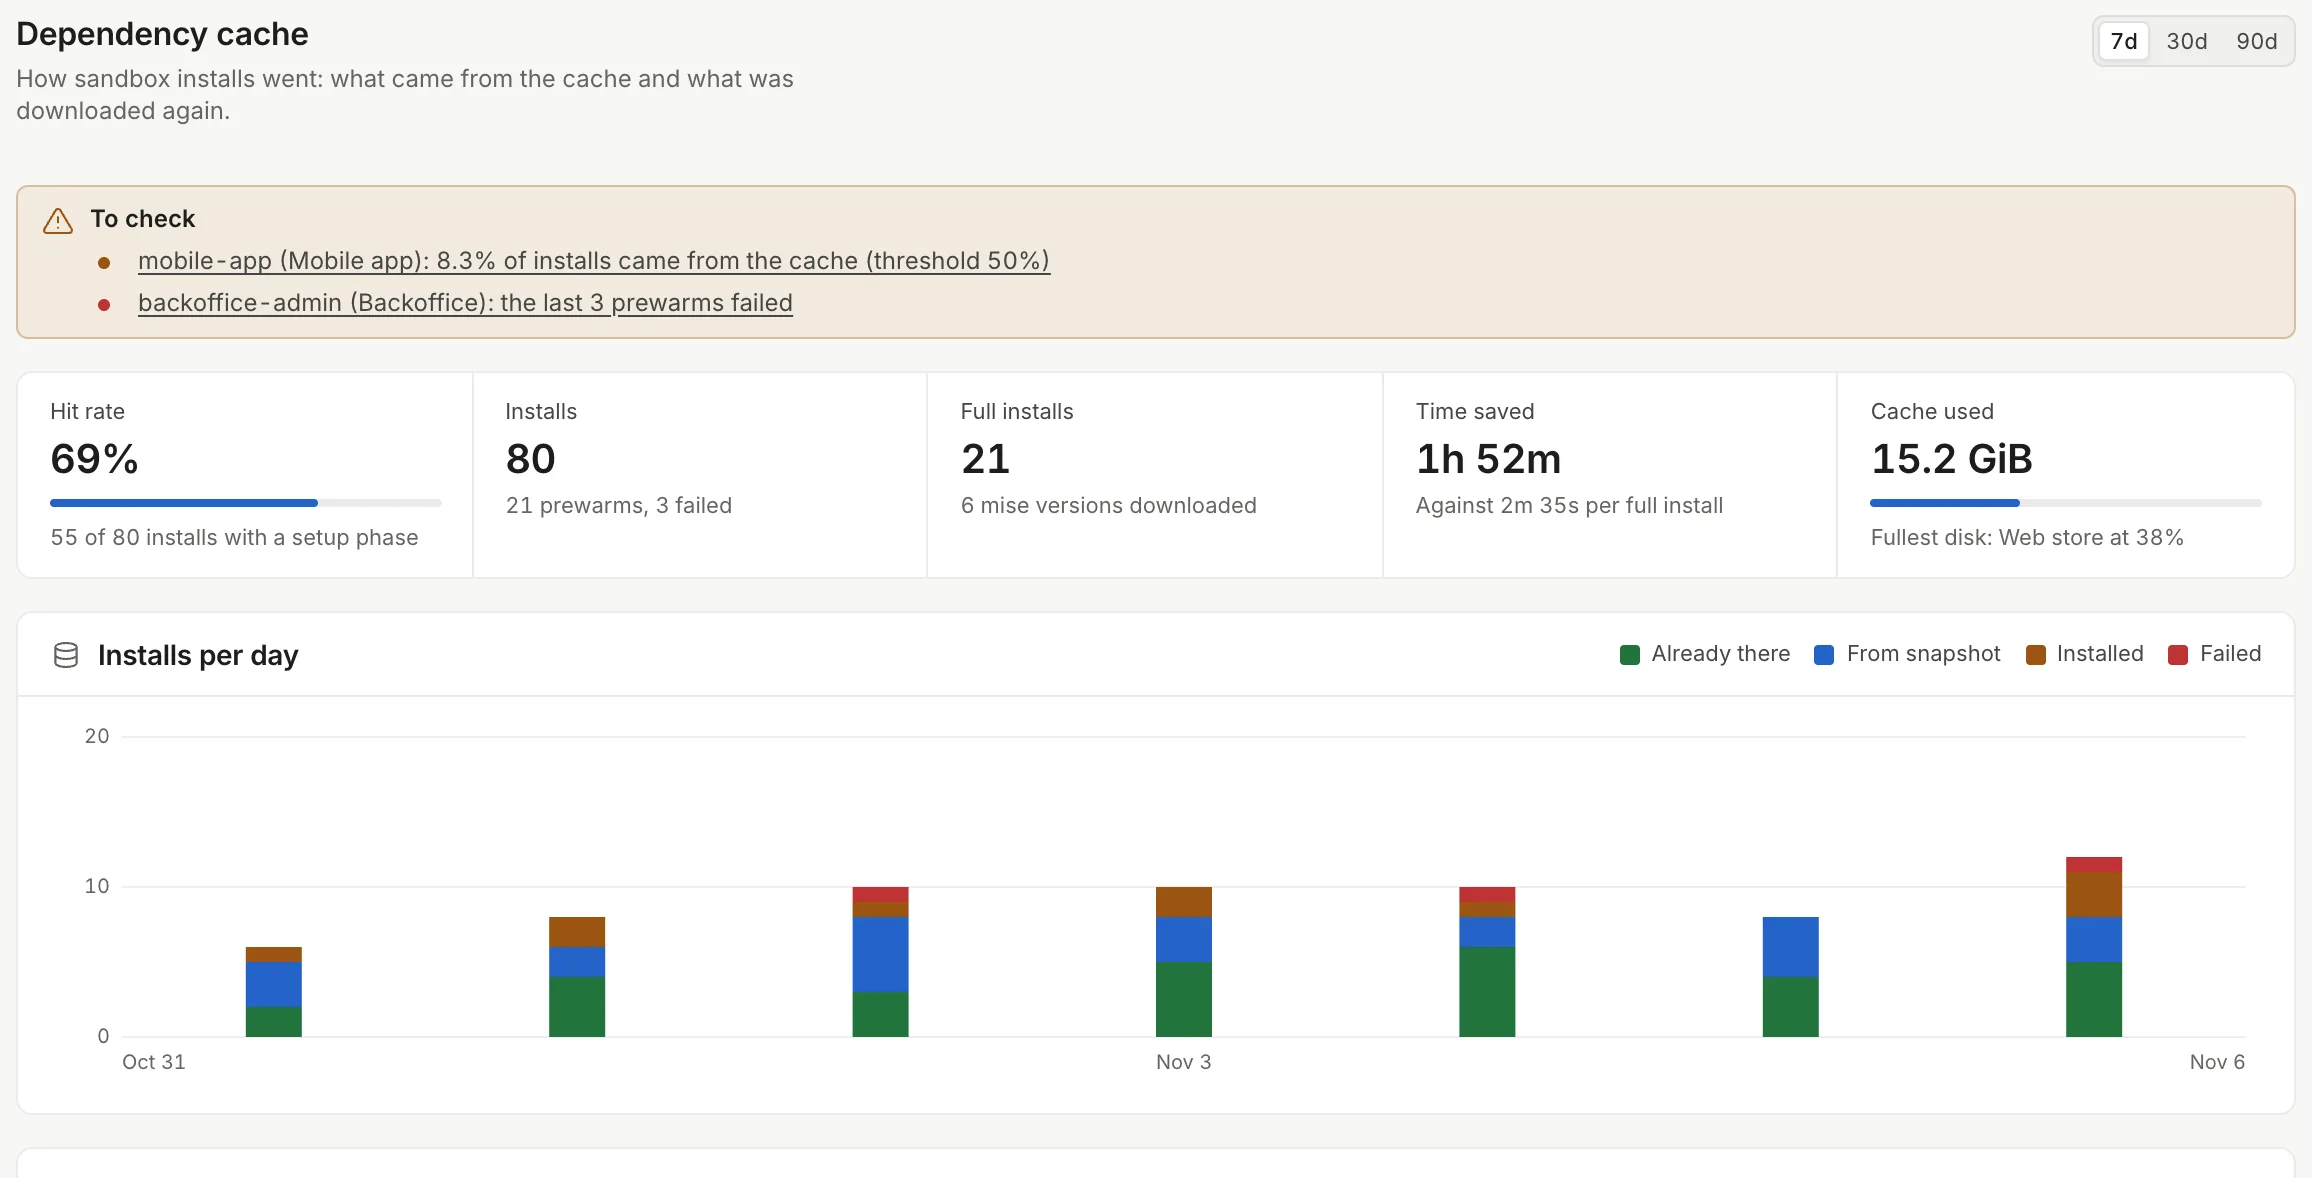
Read “To check”. Each line is a signal with its threshold:
| Signal | When it appears |
|---|---|
| Cache that grew | More than 50% in the range |
| Cache disk full | More than 85% |
| Few hits on a project | Under 50% with at least 5 installs |
| Prewarm that fails | 3 failures in a row (in red) |
| Setup keys that change | More than 5 different keys in 7 days: snapshots almost never match |
| mise version unused | Nobody asked for it in 30 days. It appears only once the install log covers 30 days |
Look at the five cards: “Hit rate” (installs that ended in “Already there” or “From snapshot”, out of those with a setup phase), “Installs”, “Full installs”, “Time saved” (measured on this installation against the average of a full install) and “Cache used”.
In the “Projects” table on this same tab, find the row for the signal. The colored dot sums up the state; “Prewarm” says “OK”, “Failed” or “N failed in a row”. The project name, like each signal, leads to the init script on the project page.
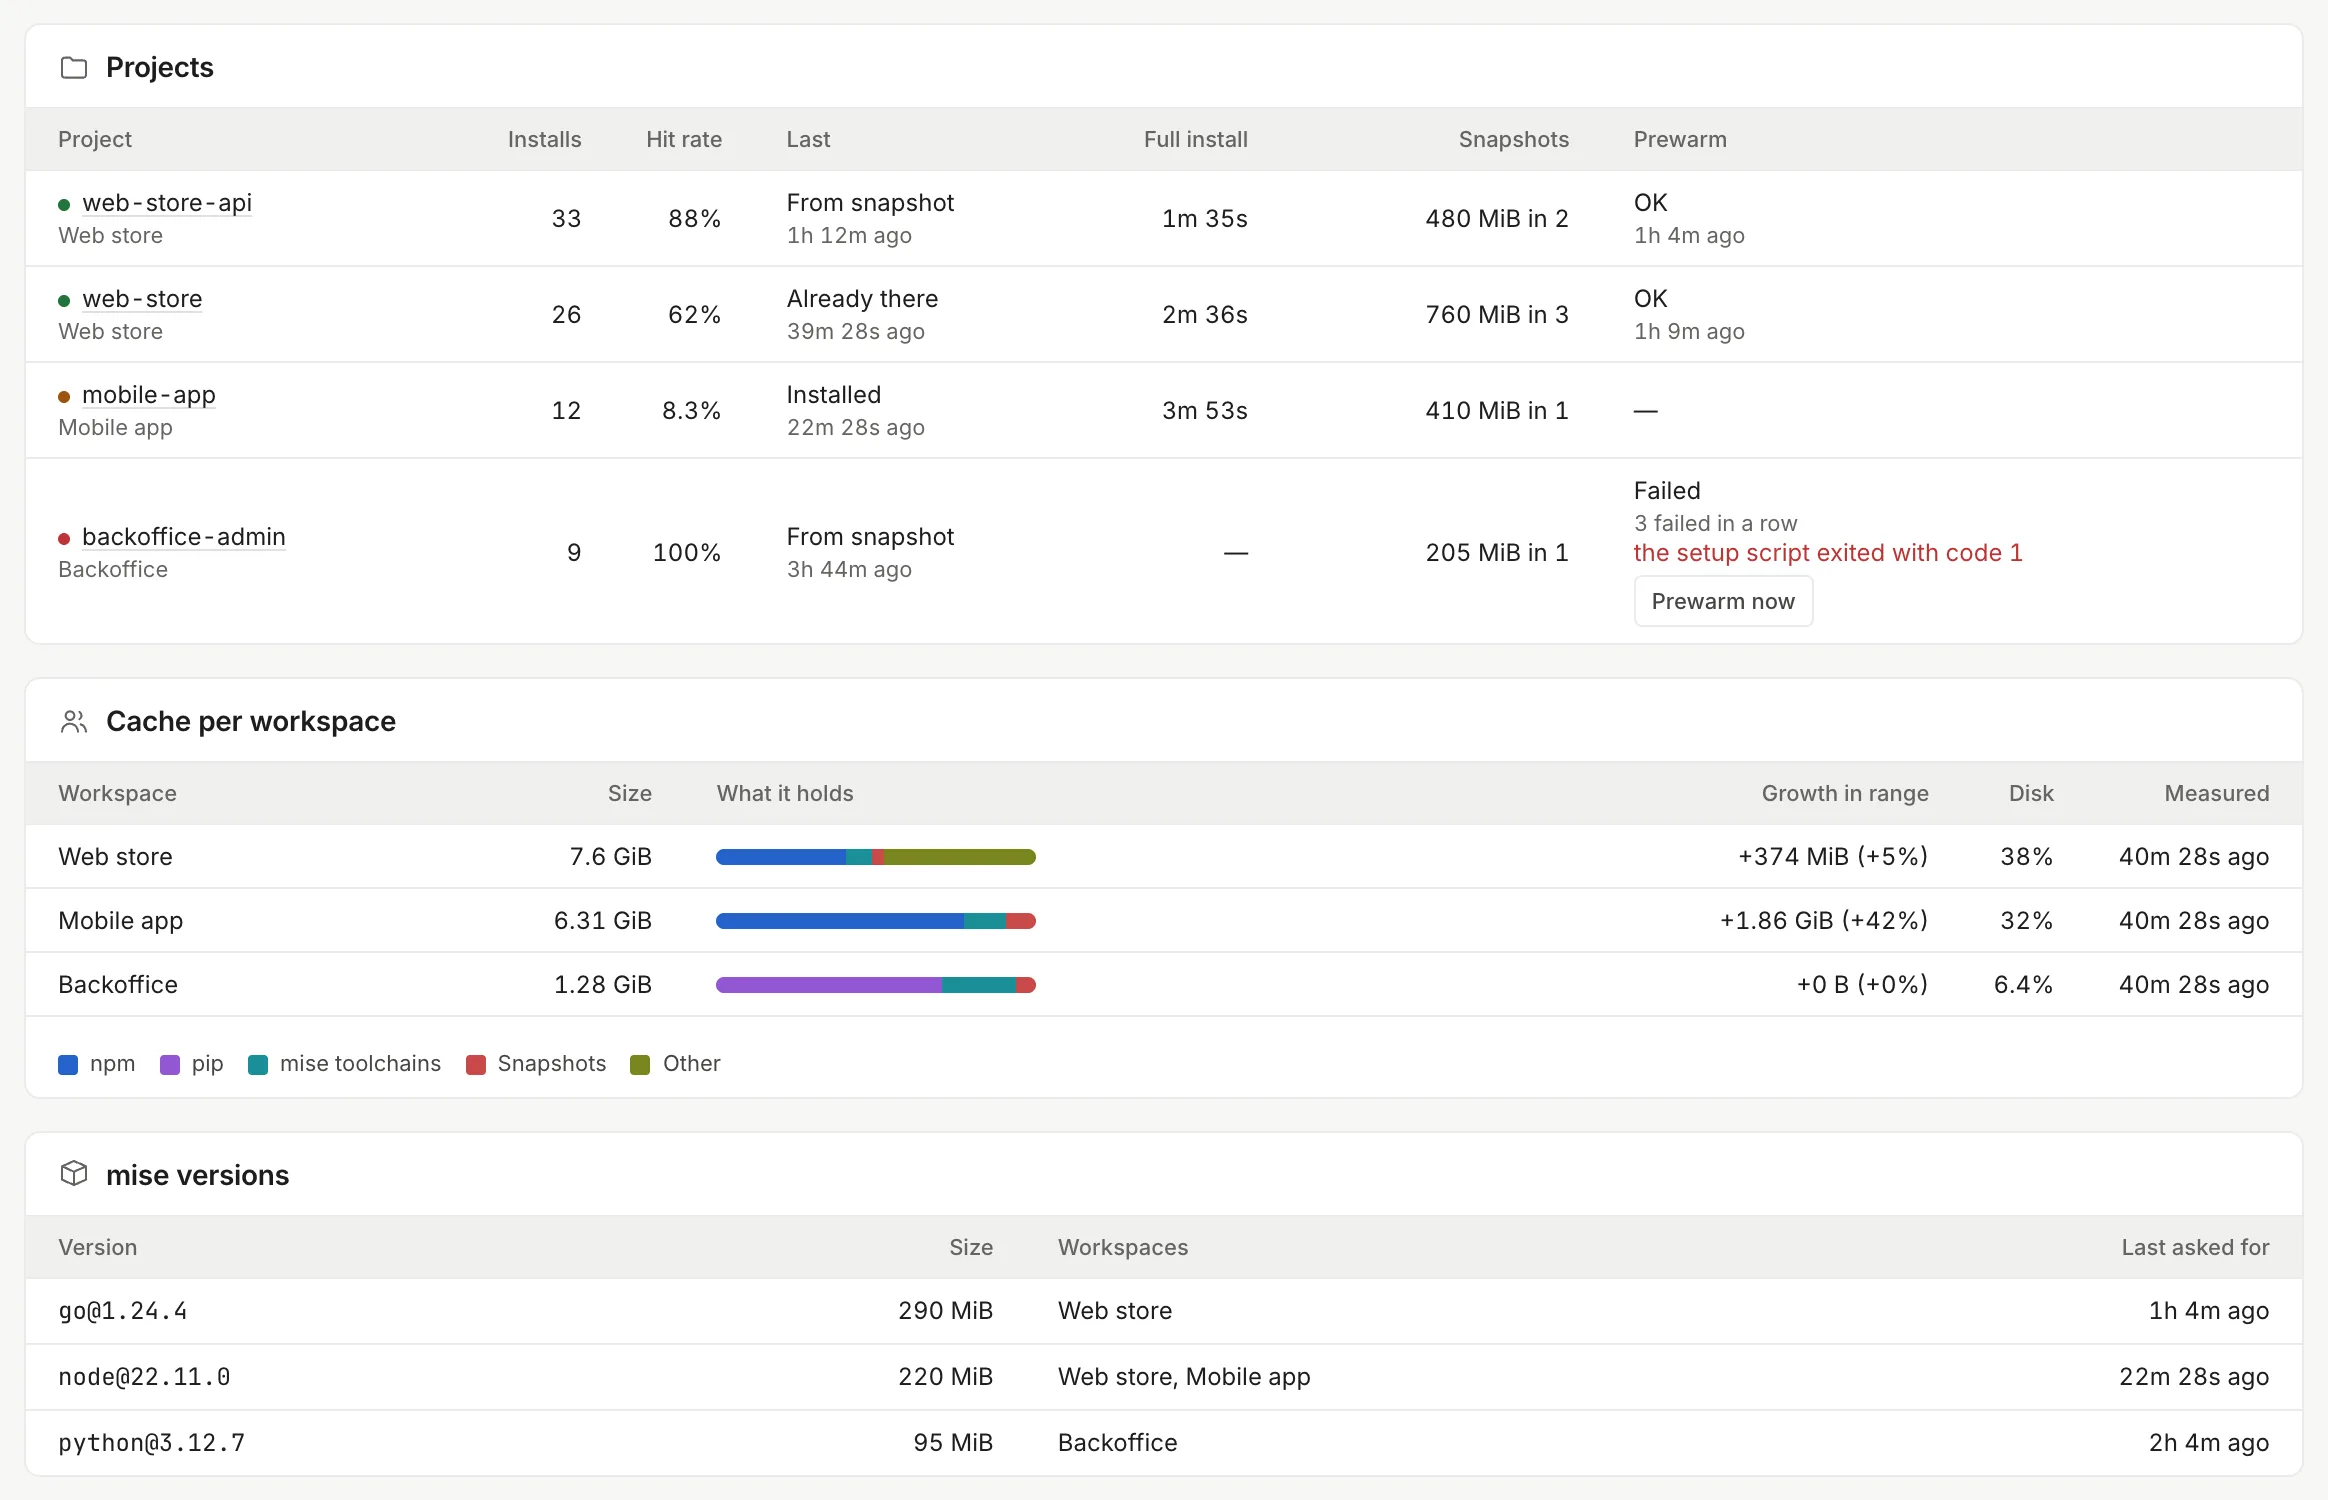
To retry, click “Prewarm now” on the project’s row: it uses the saved revision of the script and the table updates within a minute. If the prewarm fails because of the script, follow the link to the project: the “Init script” panel shows the last prewarm and the cause.
What each install result means in the “Installs per day” chart:
| Result | What happened |
|---|---|
| “Already there” | The checkout already had the install for that key; nothing ran |
| “From snapshot” | A snapshot of the default branch’s prewarm was restored |
| “Installed” | The full setup ran, with warm caches |
| “Failed” | The setup or the tool install failed |
If a project has few hits and many different keys, its cache key depends on files that change with every task. Check the “Lock files” field of the init script: it must list only the files that decide the install, such as package-lock.json (see Sandbox).
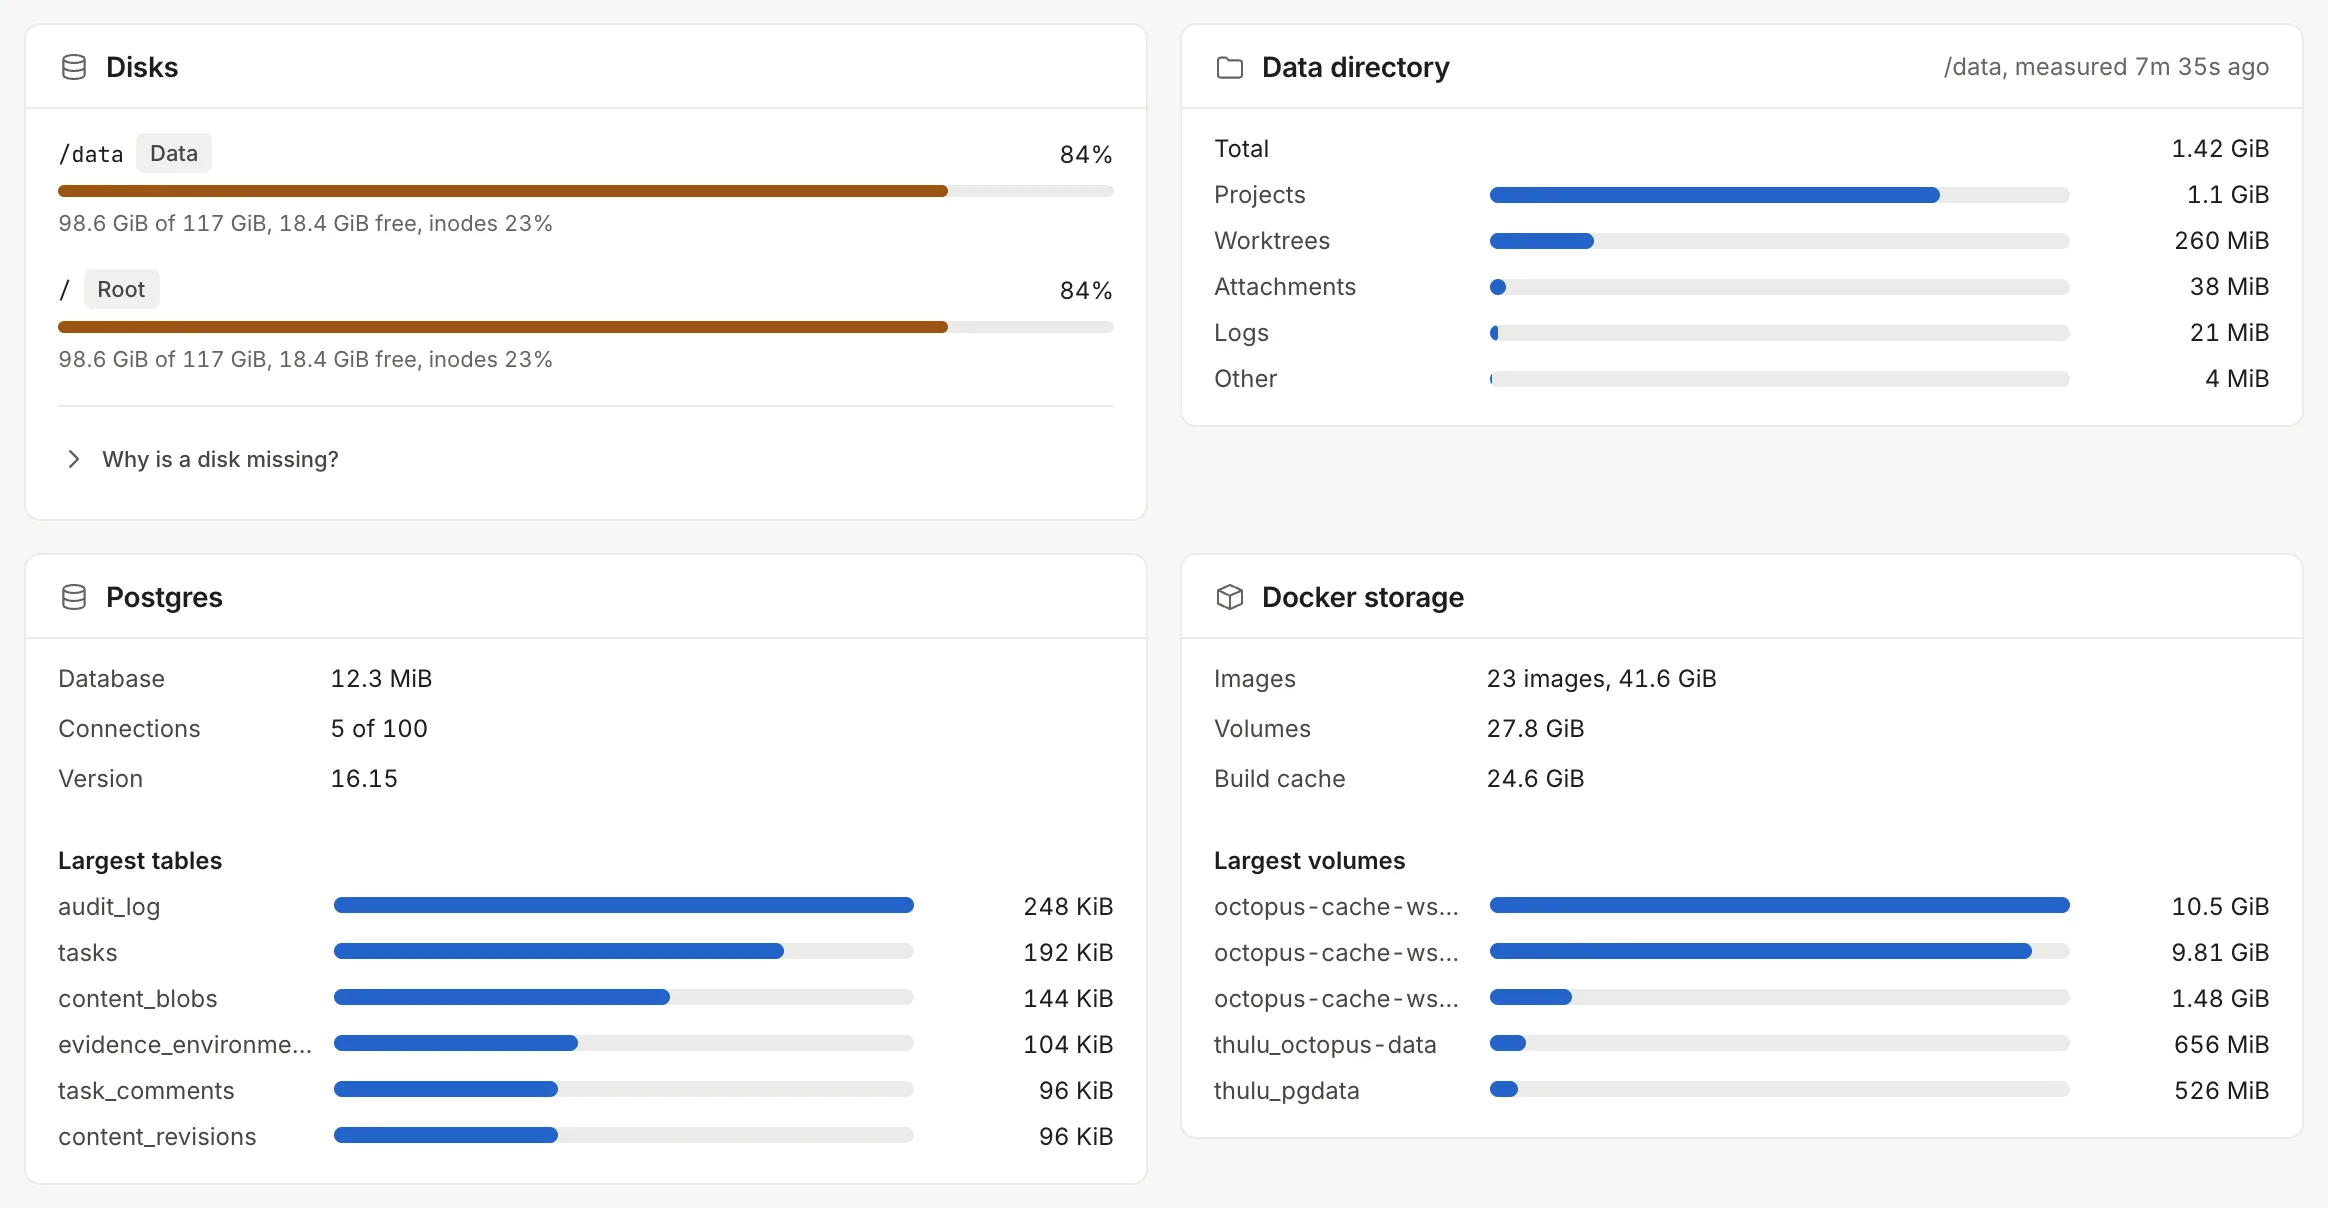
“Storage” shows each disk the daemon can see (data, root, Docker, Postgres) with its usage and inodes; the data directory split into projects, worktrees, attachments, logs and run output; Postgres’s size and connections with its largest tables; and, on Docker, images, volumes, build cache and the largest volumes. The data directory and Docker are measured every 10 minutes (“measured 7min 31s ago”).
If a disk is missing, open “Why is a disk missing?”: the daemon sees only what its container mounts. Mount it and add the path to OCTOPUS_INFRA_DISK_PATHS.
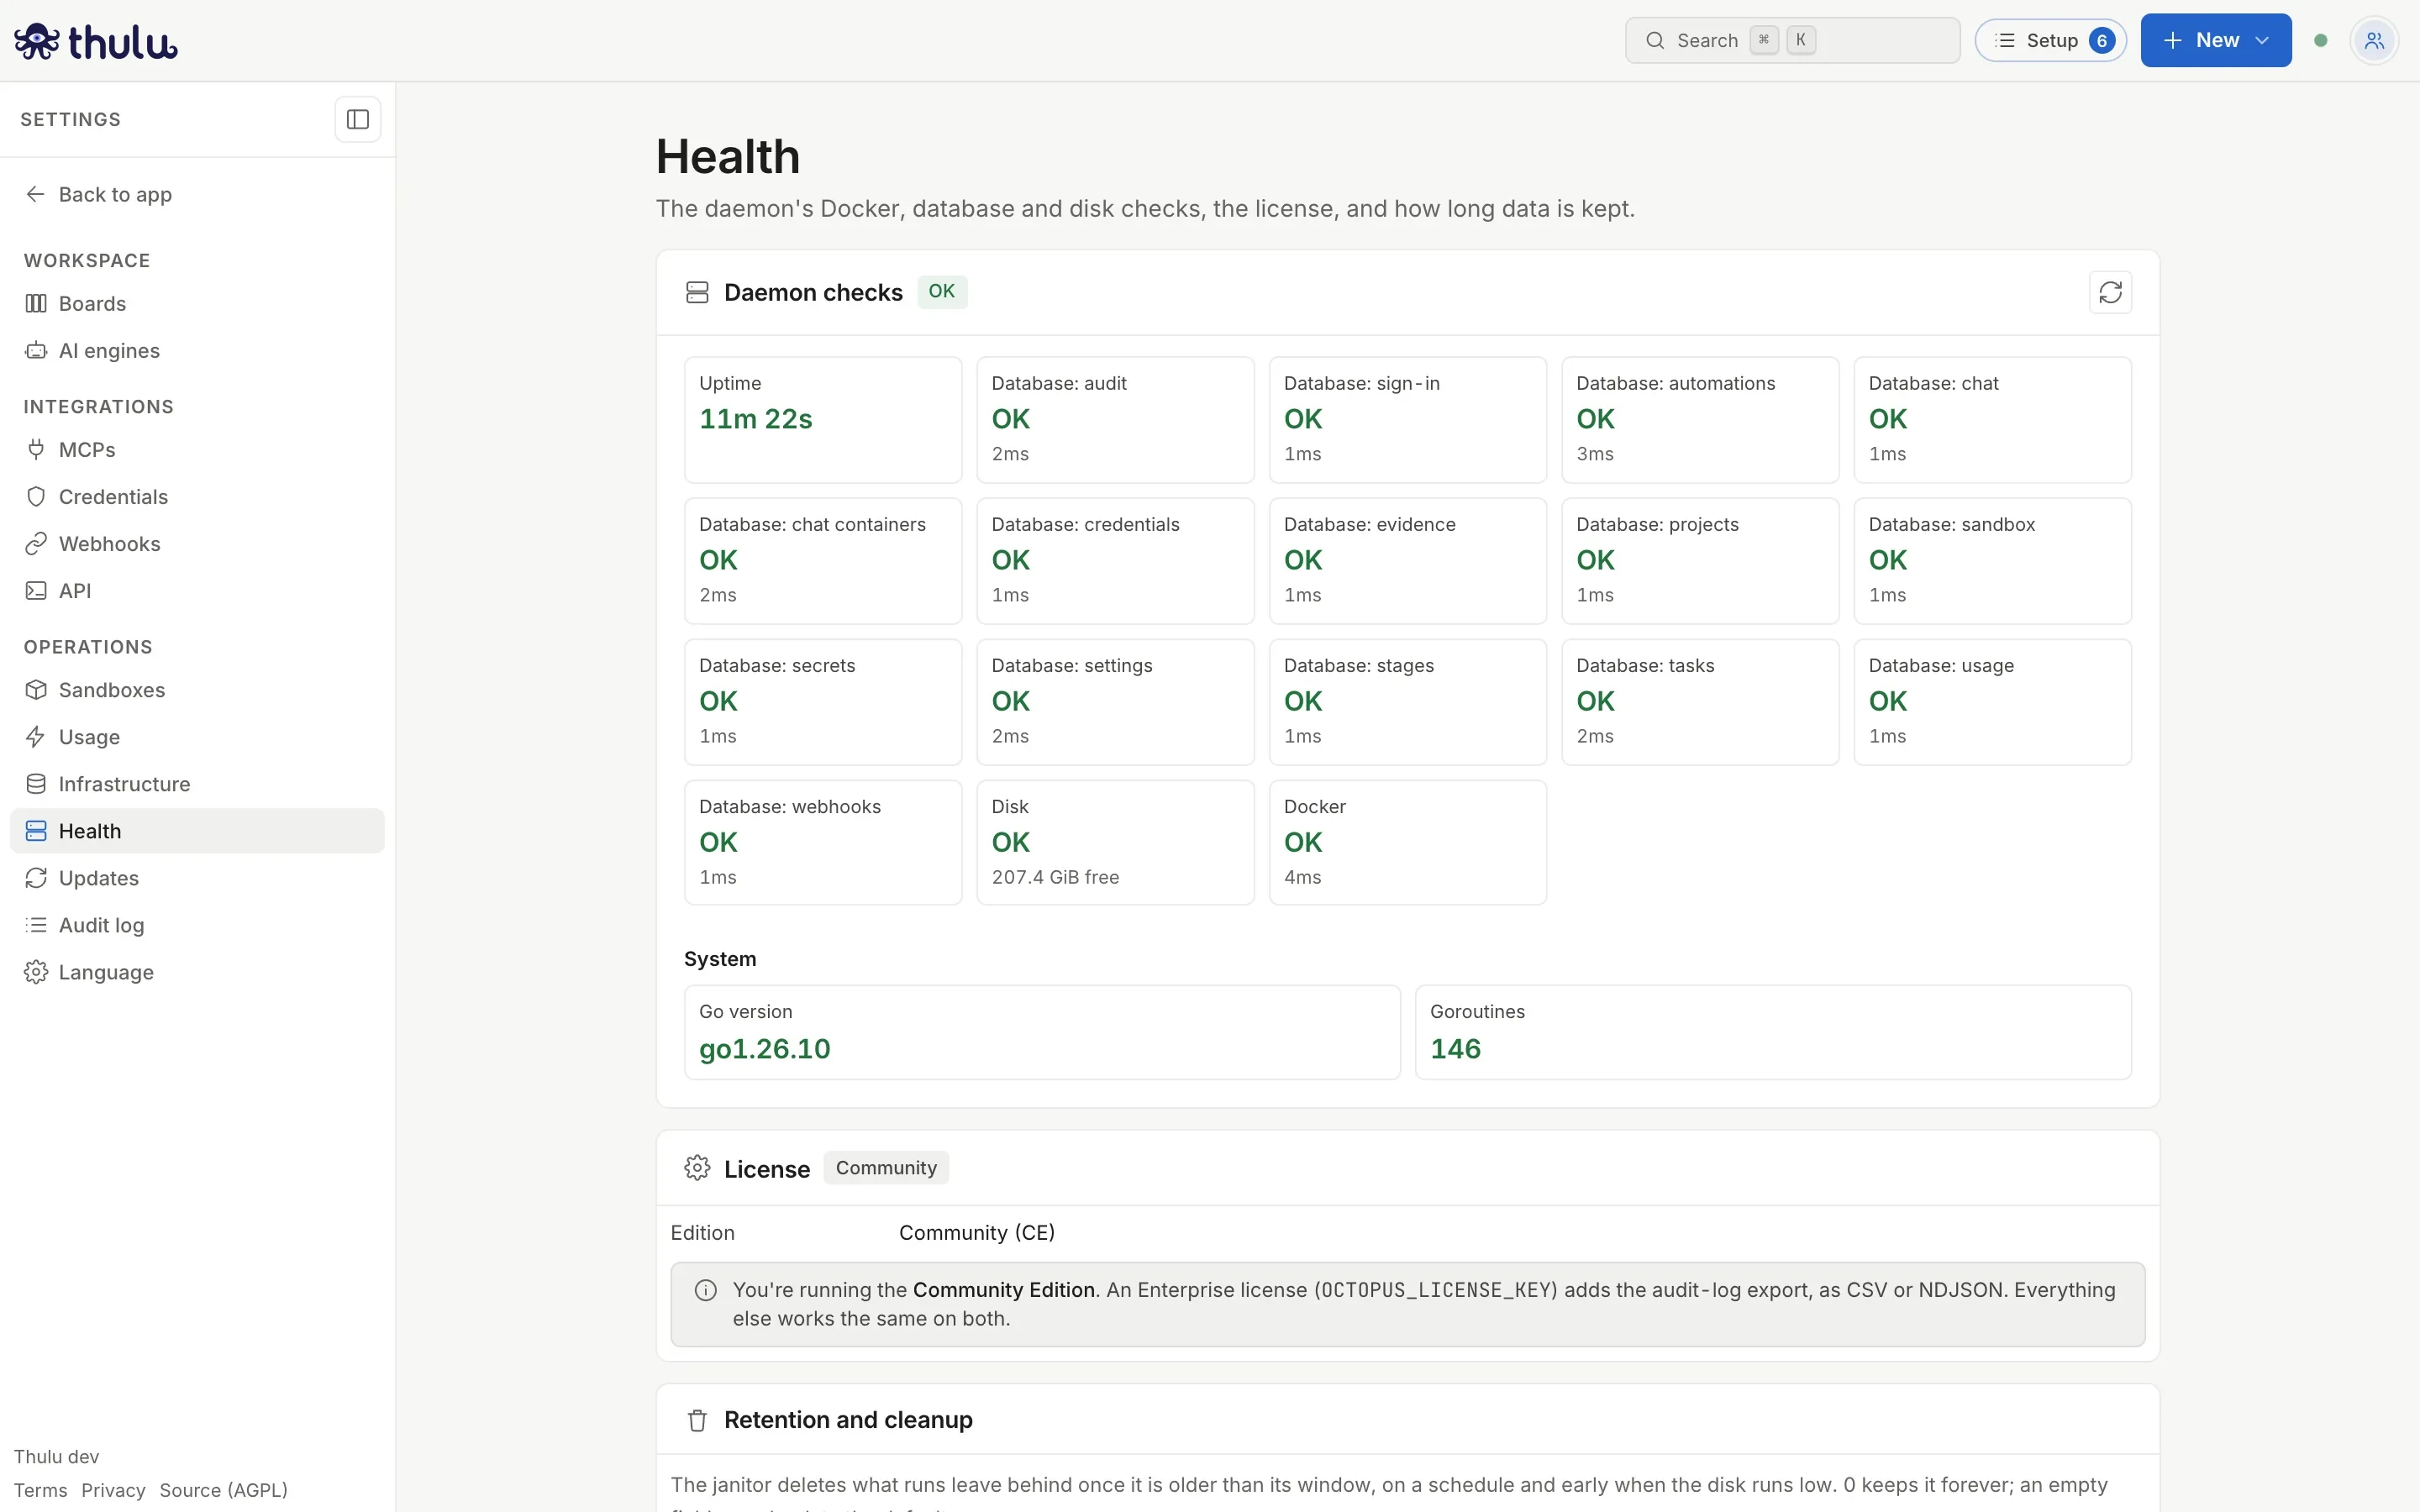
The “Health” page (in the “Operations” group of Settings) lists one check per piece: one for each of the daemon’s databases (“Database: tasks”, “Database: sign-in”, “Database: sandbox”…), “Docker” and “Disk”, each with its status and latency, plus uptime and process data. At the top, a pill sums up the overall state: “OK”, or “Degraded” if something fails. The refresh icon queries again. The license is below.
A task says "Queued" (Kubernetes)
The workspace’s quota is full. Look at “Workspace quotas” and wait for another pod to end, or raise OCTOPUS_TENANT_QUOTA_CPU_REQUESTS / _MEMORY_REQUESTS.
A task says "Queued" (Docker)
The agent cap of the installation or of the workspace plan is full, and the task’s card says so. The run starts when another one ends; to give it more room, raise “Agent containers” in “Capacity”.
A run fails instantly because of the quota
The pod requests more than the whole workspace quota. The message names the resource and the variable to raise.
The agent can't get a sandbox
Look at “Sandboxes N of M” in “Capacity”. If it is full, raise the limit right there or look in “Sandboxes” to see who holds a slot. On Kubernetes, check that the reserved CPU quota covers agent and sandbox (1.5 CPU per task).
Disk in red or "Disk" failing
Open “Storage” to see which folder or volume is growing. Health’s “Disk” check fails with less than 1 GB free on the disk the daemon runs from.
Slow installs in the sandbox
Open “Dependency cache”: few hits or failed prewarms. The fix is in the project’s init script.
A piece failing in Health
A database that doesn’t answer shows as “Database: …” failing with the error; “Docker” failing means the daemon can’t reach the Docker socket. See Self-hosted operations.
| Message | What’s happening | What to do |
|---|---|---|
| “Only the operator sees this page” | You aren’t an admin of the operator workspace (this also applies to operator members who aren’t admins) | Use Usage and costs or ask an operator admin to look |
| “Your role can’t open this page” | The daemon refused the read because of the role without saying you need to be the operator (for example, with an older daemon) | Ask an admin of the operator workspace to look or to change your role |
| “The inspector isn’t running” | The daemon started without the inspector | Restart it and check the logs for why it didn’t start |
| “Some sources couldn’t be read…” | Docker, Kubernetes, metrics, Postgres or settings didn’t answer | That source’s numbers are left out; the notice says which |
| “Host /proc isn’t readable” on CPU and Memory | The daemon can’t see /proc (macOS or a locked-down container) |
Mount the host’s /proc and point OCTOPUS_INFRA_PROC_ROOT at that path |
| “metrics-server isn’t installed or isn’t answering…” (Machine) | Kubernetes without metrics-server | Install it (k3s ships it); meanwhile you see requests and limits but not usage |
| Row | Key | Default |
|---|---|---|
| “Agent containers” | agent.max_containers |
0, no cap (SaaS: CPUs − 2, minimum 2) |
| “Mention containers” | mention.max_containers |
3; 0 means no cap |
| “Sandboxes” | sandbox.max |
3, minimum 1 |
| “Chat containers” | chat.max_containers |
5, minimum 1 |
| “Longest wait in the agent queue (minutes)” | agent.max_queue_minutes |
120, between 1 and 720 |
Each row has its own field: type the number and click “Save”. The limits apply to all workspaces in the installation. Through the API, the same key is changed with PUT /settings/<key> and an API key from the operator workspace (see CLI and Settings). The Kubernetes per-workspace quotas (OCTOPUS_TENANT_QUOTA_*) are daemon variables or Helm values: see Self-hosted operations.