

Metrics and dashboards
Thulu measures two different things. From the work the agents do it derives each project’s flow metrics (how long a task takes, how many come back, how much they cost) without you configuring anything. From your application in production it receives whatever the app sends over OpenTelemetry (OTLP) for each of the project’s environments: with that it builds the environment’s fixed signals (latency, errors, requests) and lets you chart your own metrics on dashboards. Whoever operates the installation also gets a Prometheus endpoint with the server’s metrics.
A project’s flow metrics
Section titled “A project’s flow metrics”-
Open “Projects” and go into a project. The “Overview” tab is the first one.
-
Pick the range with “From” and “To” or with the presets. The metrics count only the tasks linked to that project.
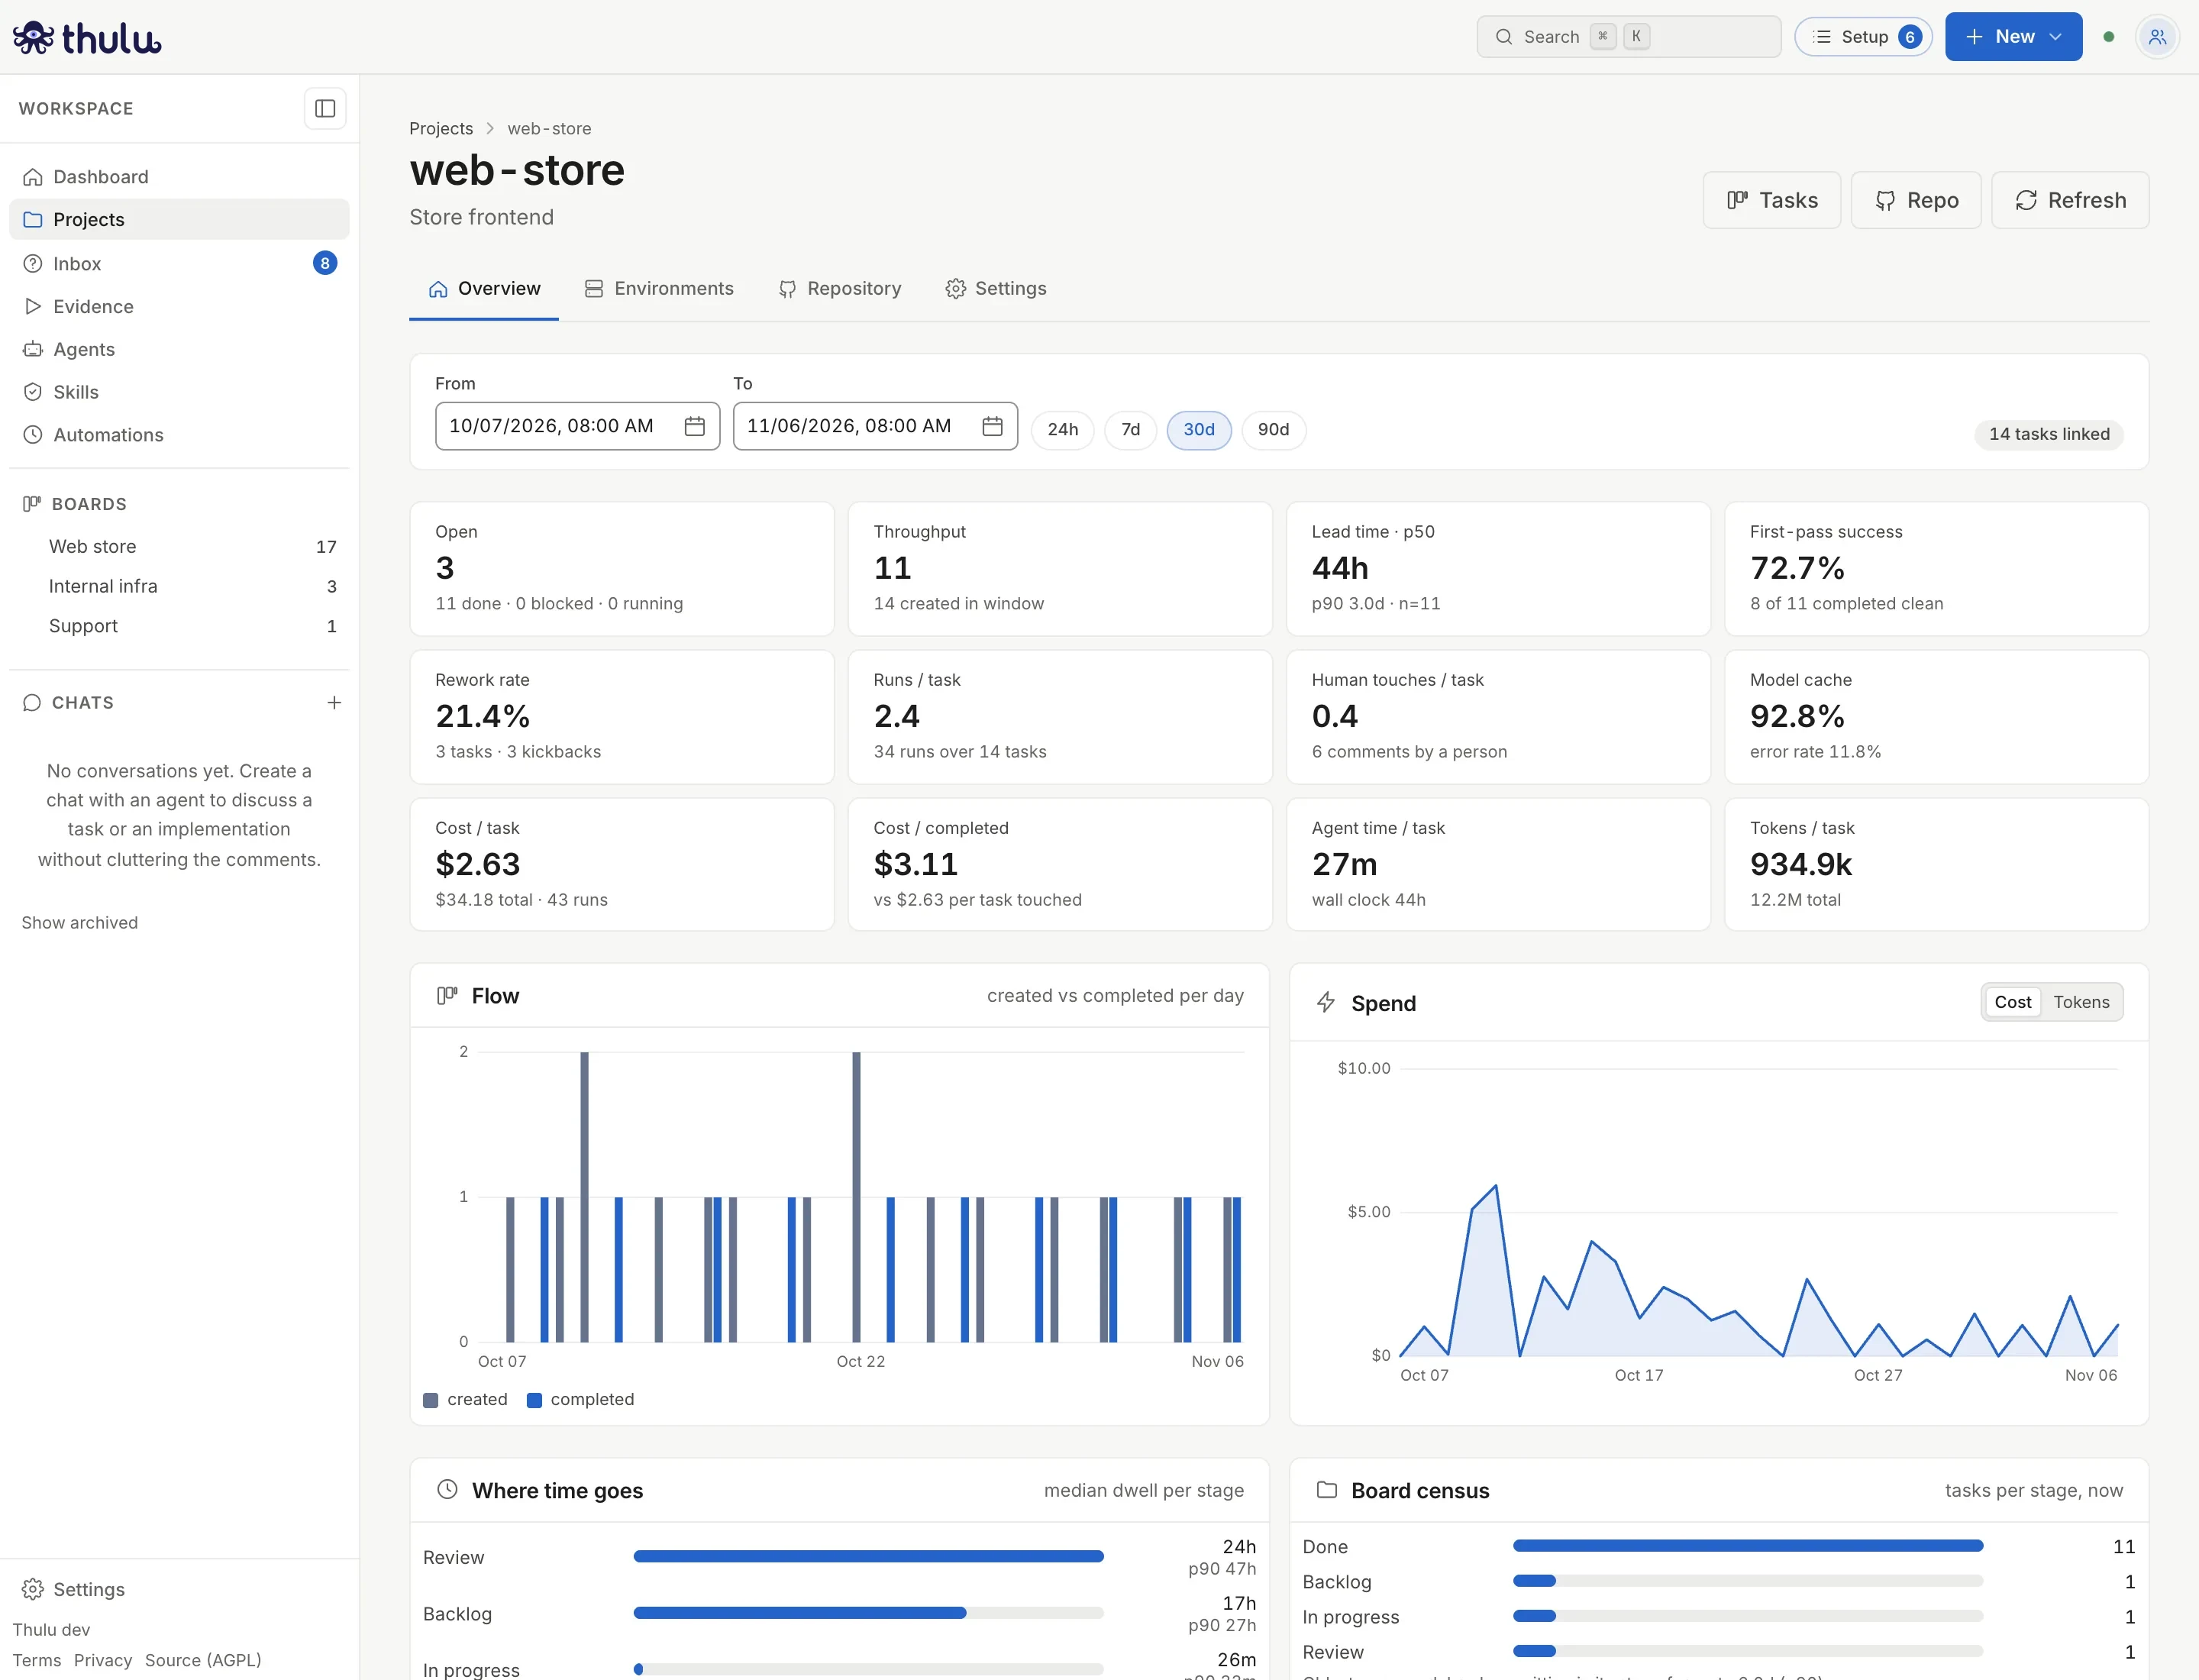
web-store over 30 days: 11 tasks completed, median lead time of 44 h and 3 of 14 tasks kicked back at least once. -
Scroll to “Where time goes” to see which stage the tasks sit in, and to “Board census” to see how many are in each stage right now.

A median of 24 h in Review against 26 minutes in In progress: tasks wait for review longer than they wait for the agent.
| Card | What it counts |
|---|---|
| “Open” | Linked tasks that are not in a terminal stage today, including those waiting in the first column. It is a snapshot of now: it doesn’t depend on the range. |
| “Throughput” | Tasks completed within the range. |
| “Lead time · p50” | Median time between a task being created and being completed, with the p90 underneath. |
| “First-pass success” | Completed tasks that never went backward. A single kickback in their whole history disqualifies them, even if it happened before the range. |
| “Rework rate” | Tasks that were sent back to an earlier stage, with the number of kickbacks. |
| “Runs / task” | How many times an agent ran per task, on average. |
| “Human touches / task” | Comments written by people, per task. Those by agents and the system don’t count. |
| “Model cache” | The share of the model’s input that came from its prompt cache. |
| “Cost / task” and “Cost / completed” | Agent spend divided by the tasks with activity in the range or by the tasks completed in the range. |
| “Agent time / task” | Median time the agents were running per task, with the wall-clock time underneath. |
| “Tokens / task” | Agent tokens per task, cache included, with the total underneath. |
“Where time goes” uses only closed stays: if a task entered Review and is still there, it doesn’t count until it leaves. Further down are the project’s “Cost by stage”, “Cost by model” and “Most expensive tasks”; the spend of the whole workspace is in Usage and costs.
Connect your app’s telemetry
Section titled “Connect your app’s telemetry”For an environment to receive data from your application you need an ingest token for that environment and an OpenTelemetry SDK or collector pointed at Thulu. The environment is created beforehand in the project’s “Environments” tab, as described in Projects. Creating and revoking tokens, approving metrics and building or approving dashboards is for workspace admins; looking at the data is for anyone who can see the project.
-
If your installation is published at a different address than the one you use to sign in (a proxy, a domain), enter it in Settings, “API”, “Telemetry address” panel, and click “Save”. It applies to the whole installation, so only whoever operates it can save it; everyone else sees it locked. It is the address that builds the variables block of the “Telemetry” modal and the one given to agents when they have to explain to someone how to connect an app.
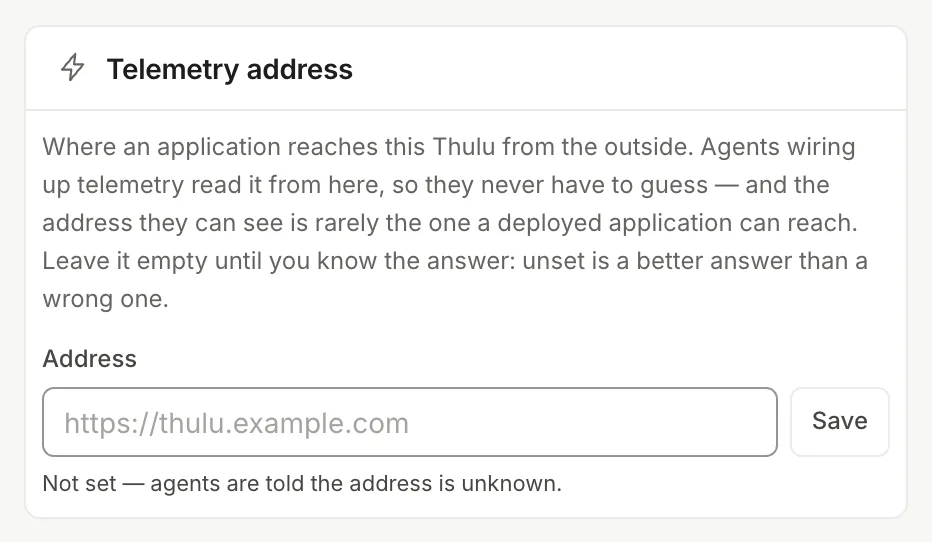
Without an address, the modal uses the browser's and agents are told it is unknown. -
In the project, open “Environments” and click the bolt icon (“Telemetry”) on the environment.
-
Type the “Token name” (for example
collector-prod; it is how you tell collectors apart in the table) and click “New token”. The modal shows the token and a block with three variables. Copy it right then: the token is not shown again.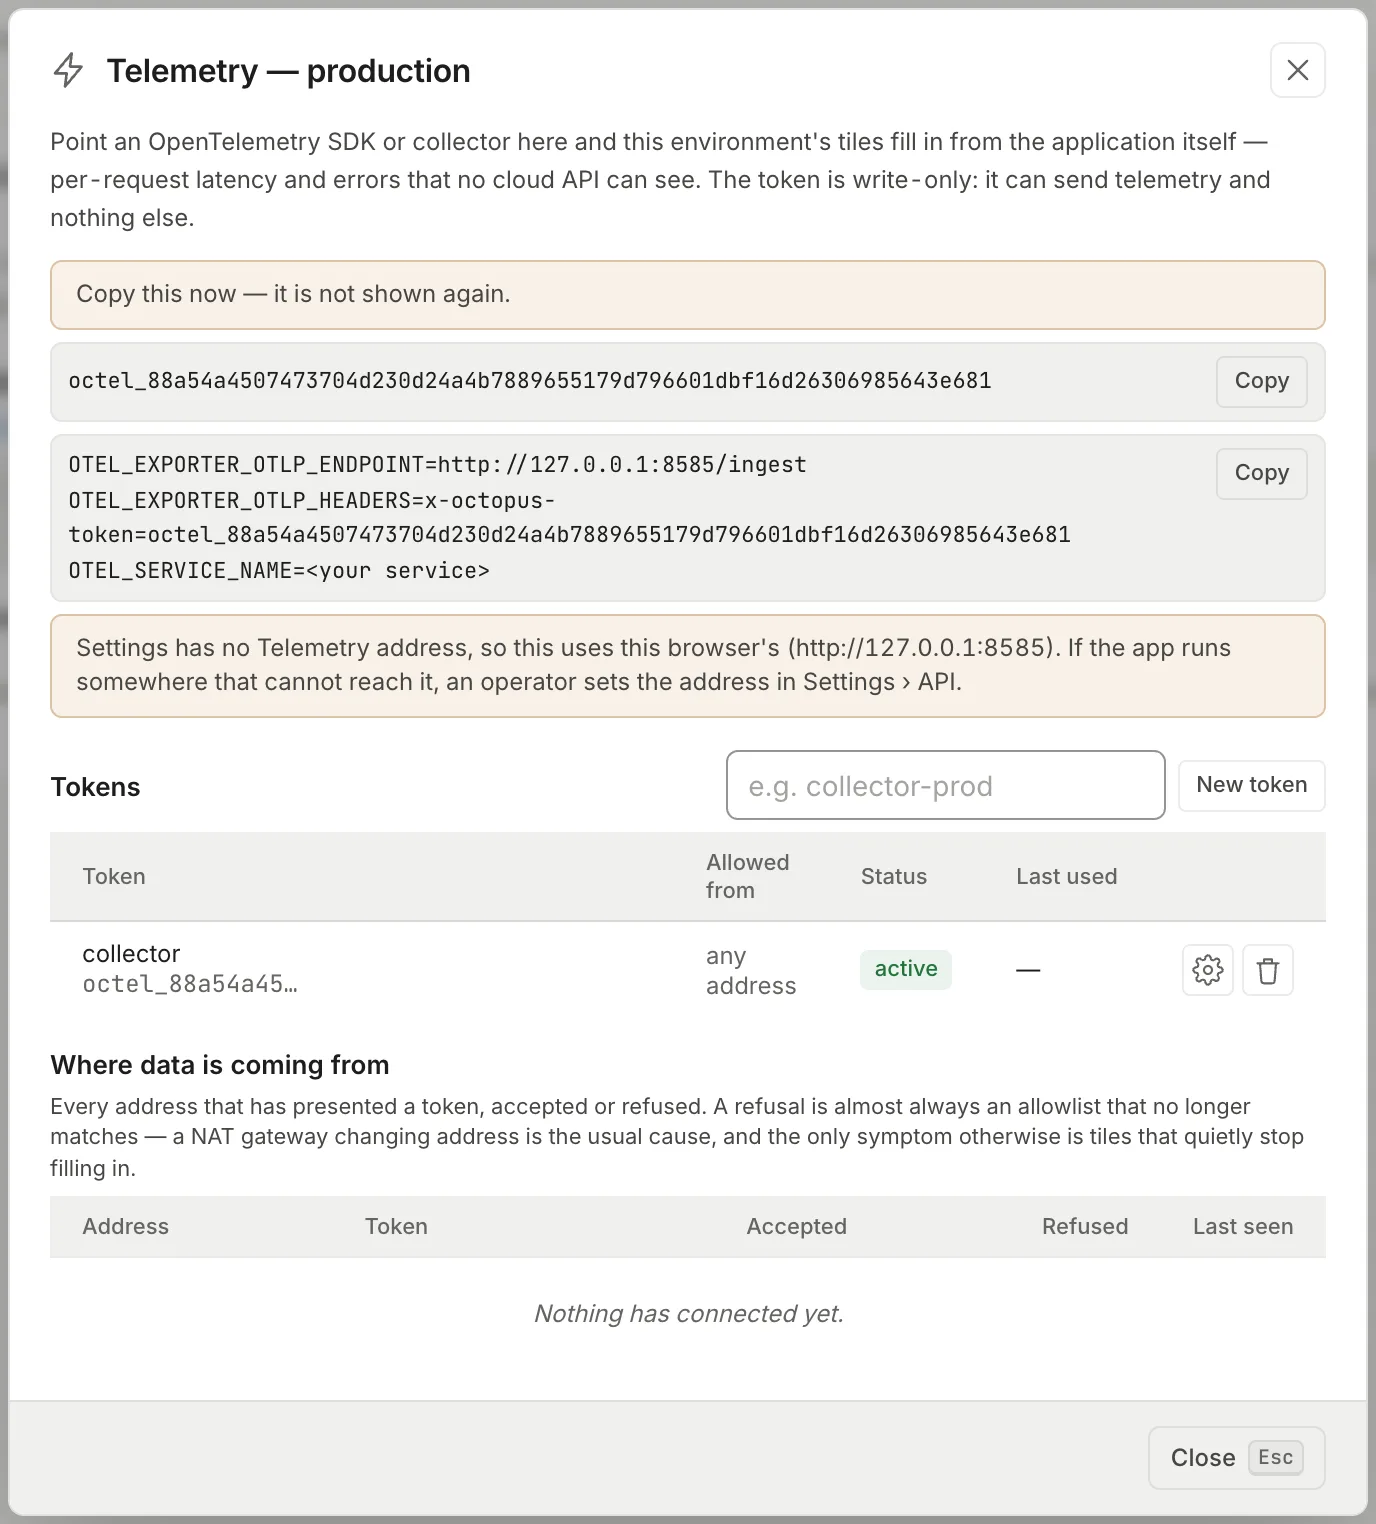
The token can only write telemetry to this environment. -
If you want only certain networks to be able to send data, click the gear icon (“Allowed addresses”) on the token’s row. In “IPs or CIDR ranges” type the addresses separated by commas (for example
10.0.0.0/8, 203.0.113.7). Empty means “any address”. -
Set the three variables in your app or your collector and replace
<your service>with the service name. Check thatOTEL_EXPORTER_OTLP_ENDPOINTpoints to Thulu’s public address followed by/ingest. -
Go back to the modal: “Where data is coming from” shows each address that presented the token, with accepted and rejected counts and the last time it was seen.
Thulu accepts OTLP over HTTP, in JSON or protobuf, at /ingest/v1/metrics, /ingest/v1/traces and /ingest/v1/logs, with the token in the x-octopus-token header (or as Authorization: Bearer). Logs are accepted and discarded: they aren’t stored today. Each submission can weigh up to 4 MiB, and each token has a cap of 600 submissions per minute; past that the app receives a 429 with Retry-After.
When a submission is rejected, the app always gets the same response, so it gives no hints to anyone probing tokens. The reason (“token revoked”, “token not recognised”, “address not on the allowlist”) is visible only in “Where data is coming from”. The trash can icon (“Revoke”) asks for confirmation, cuts the token off immediately and can’t be undone.
What Thulu does with what arrives
Section titled “What Thulu does with what arrives”From traces it takes the server and consumer spans (the ones any auto-instrumentation generates) and computes, per service and every 5 minutes, “Latency p50”, “Latency p95”, “Errors” and “Requests”. A span counts as an error if its status is error or if the HTTP response was 5xx. From metrics it takes system.cpu.utilization, process.cpu.utilization, container.cpu.utilization and their memory equivalents for “CPU” and “Memory”. Those are the environment’s fixed signals. They appear as cards below the environment’s row, with the “reported by the app” mark, about a minute after each 5-minute interval closes.
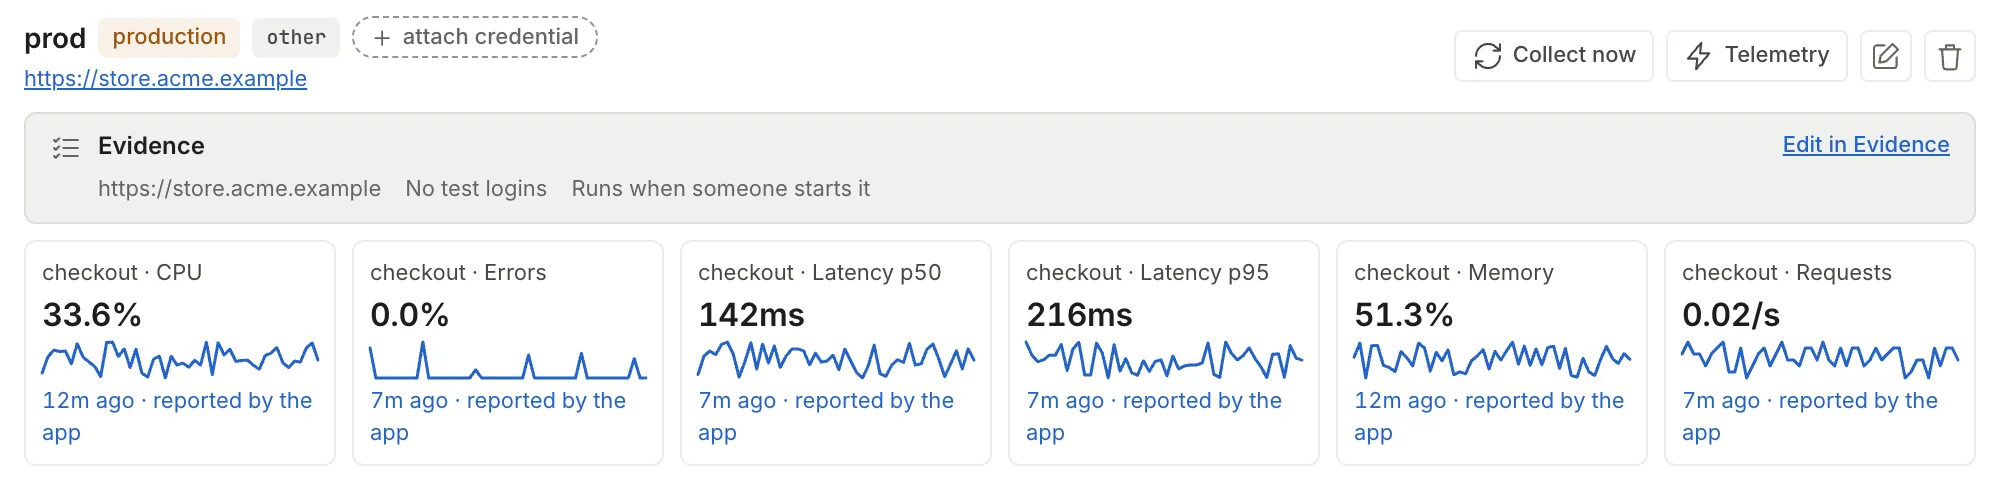
Any other metric the app sends goes to “Custom metrics”.
Approve custom metrics
Section titled “Approve custom metrics”Each new metric appears in the environment as “discovered”: Thulu stores the name, the service, the type and the labels, but doesn’t let you chart it until someone approves it. That way an app that sends hundreds of metrics doesn’t fill the dashboards on its own.
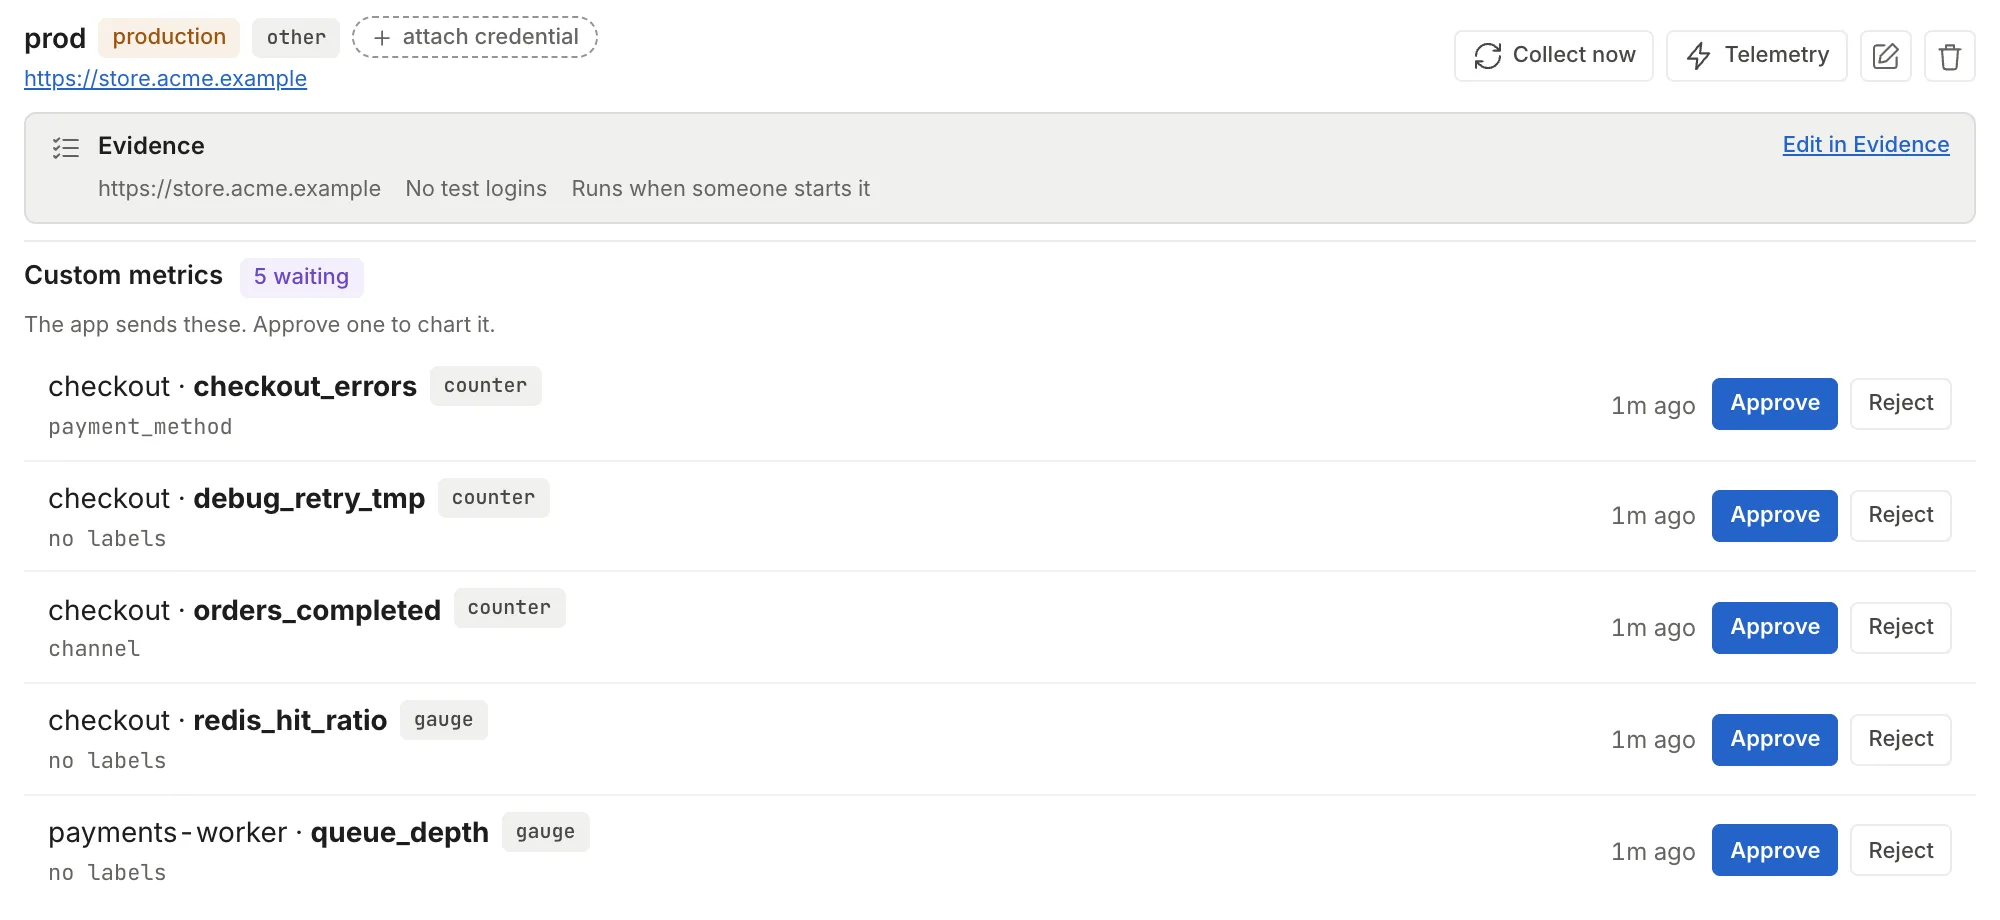
- “Approve” enables it for dashboards and for agents to read.
- “Reject” greys out the row and stops storing its points. The row is kept so the metric doesn’t show up as new again on the next submission.
Both actions apply with one click. Resolved metrics stay in the list with the “approved” or “rejected” mark, and each has “Back to waiting” and a button to delete it. Deleting asks for confirmation and also deletes the stored points; if the app keeps sending it, it comes back as waiting.
| What the app sends | How Thulu stores it |
|---|---|
| Monotonic sum (an OTLP counter) | “counter”. It stores how much it rose in each interval; if the counter drops back to zero because the app restarted, the new value counts as an increment. The first value that arrives serves only as a starting point. |
| Gauge or non-monotonic sum | “gauge”. The value is stored as is. |
| Histogram | Ignored. |
Points are grouped every 5 minutes and kept for 90 days. There are ceilings per environment: 50 metrics, 6 labels per metric (if there are more, the first 6 in alphabetical order stay) and 20 distinct values per label; from the 21st value on, everything is lumped into other. When the environment reaches 80% of its metric quota, a “registered” counter appears next to the title.
Dashboards
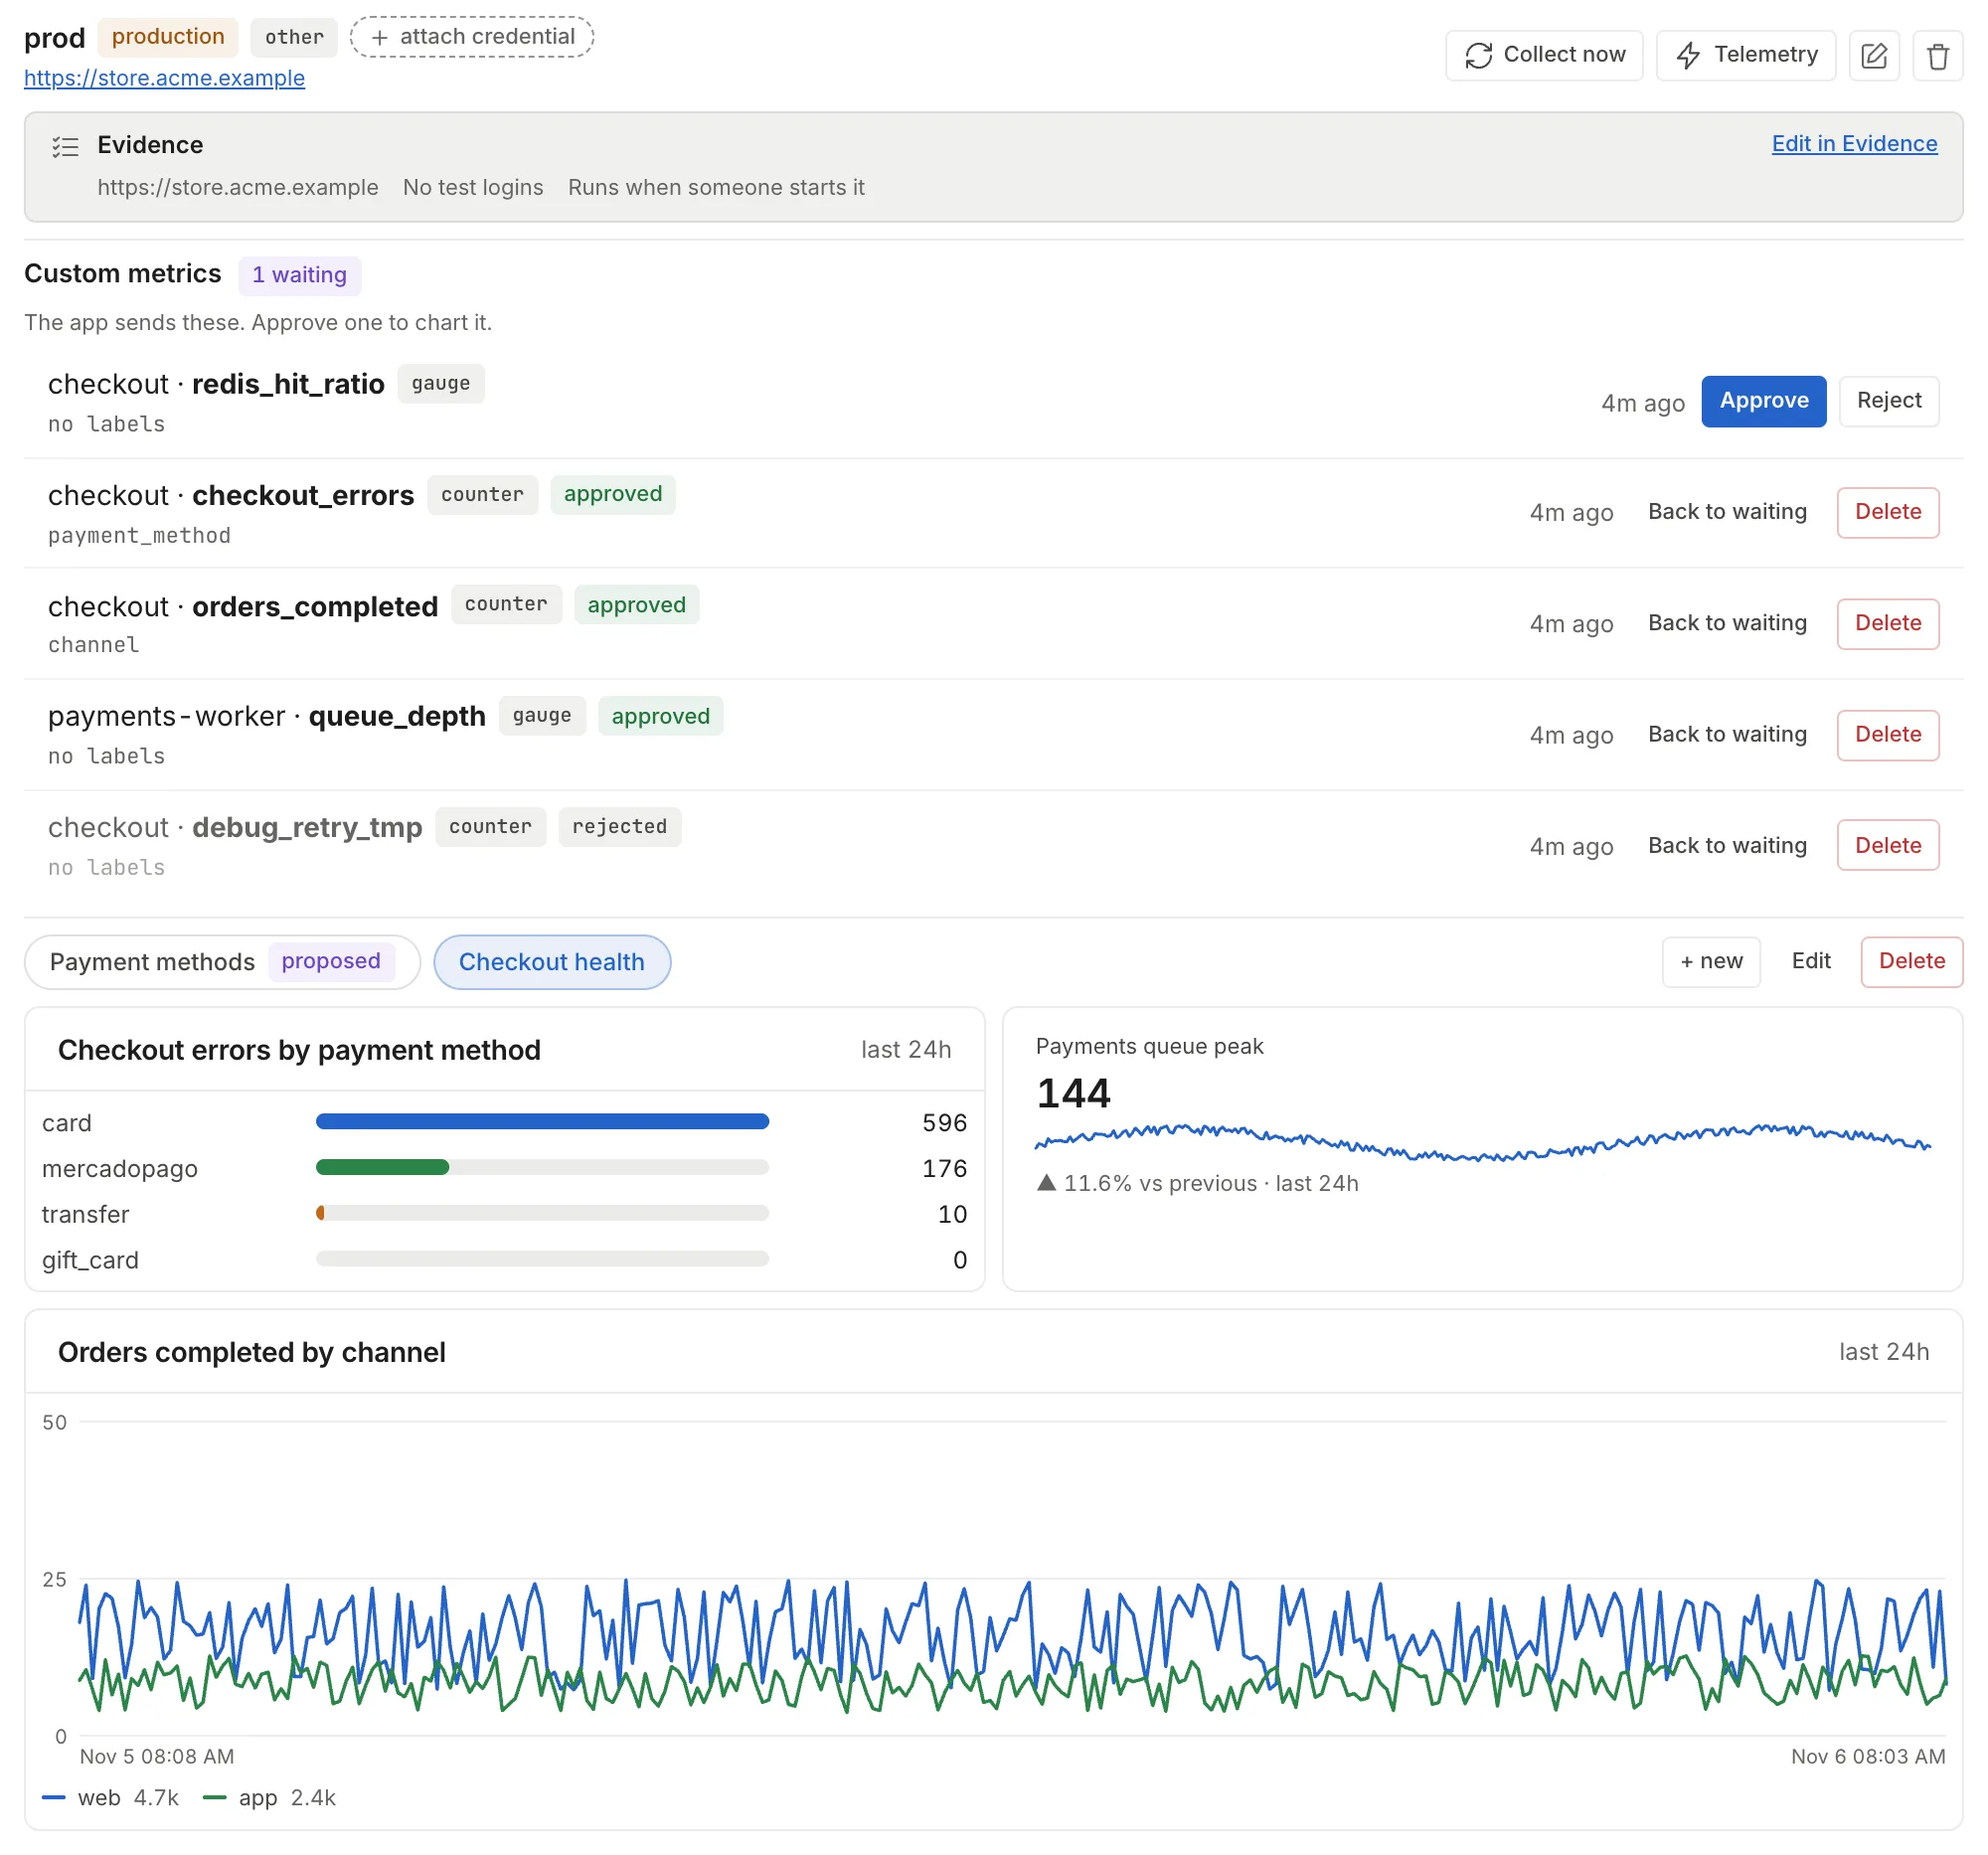
Section titled “Dashboards”Below the custom metrics is the environment’s “Dashboards” block: one tab per dashboard, “+ new” and “Edit”. While no metric is approved, the block says “Approve a custom metric above to build a dashboard.”
Create one by hand
Section titled “Create one by hand”-
Click “+ new” and type the “Name”.
-
Fill in the first panel, which starts as “Line” with the first approved metric. At the top are “Title” and “Chart”. Below, “Metric”, “Aggregation”, “Split by” (the label), “Hours” (up to 2160, the 90 days that are kept) and “Width” (“half row” or “full row”). “Chart” offers only the types that suit the chosen metric.
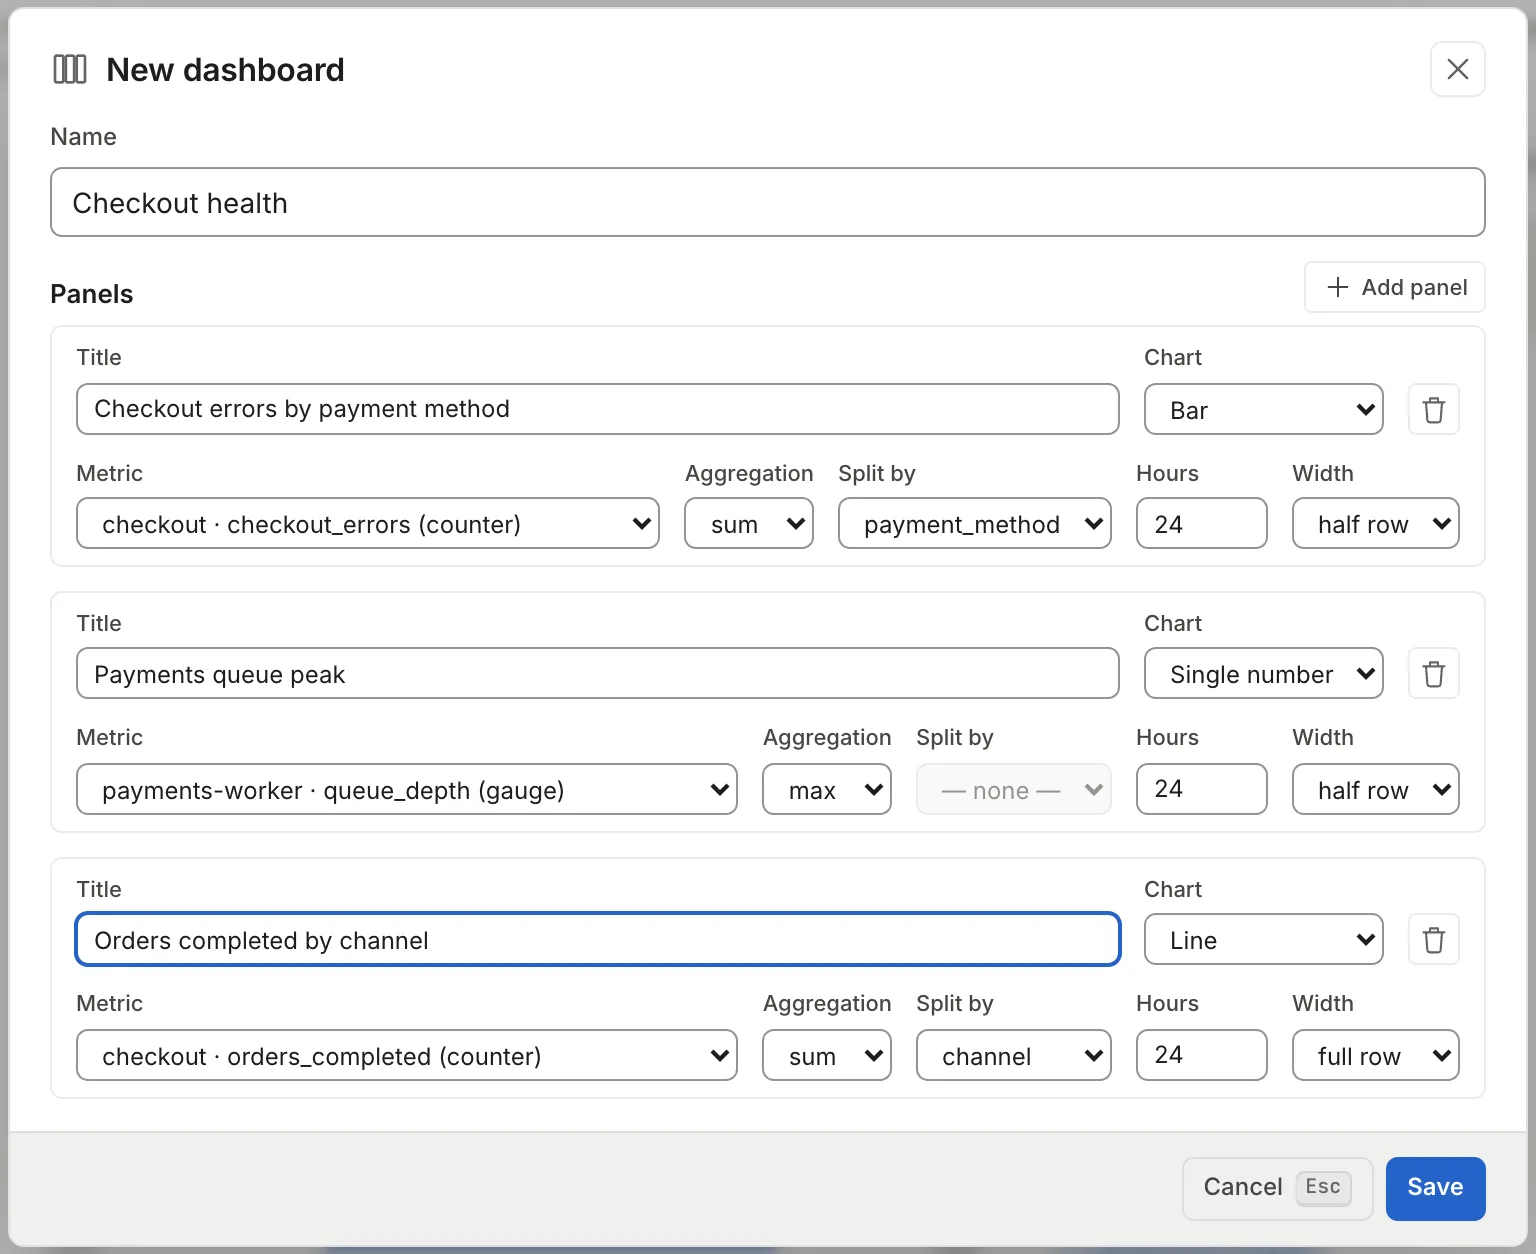
Seven fields per panel. Pick the metric first: the aggregations and labels offered depend on it. -
“Add panel” adds another. Up to 12 per dashboard.
-
Click “Save”. A dashboard you create yourself is published right away, without going through approval.
| Type | Series | Label to split by | Good for |
|---|---|---|---|
| “Line” | 1 to 4 | Optional | Change over time, one line per label value |
| “Stacked area” | 1 | Required | How a total is divided over time. Counters only |
| “Bar” | 1 | Required | Comparing a label’s values across the range |
| “Single number” | 1 | Not supported (the selector is disabled) | A number with a small line and the change against the previous period |
| “Table” | 1 to 6 | Required | Several numbers per label value |
For a counter you can aggregate with sum, avg, max or min; for a gauge, with avg, max, min or last. When you switch to Bar, Stacked area or Table, the editor picks the metric’s first label on its own. A metric without labels doesn’t offer those three types, and a gauge doesn’t offer Stacked area.
“Edit” opens the dashboard of the chosen tab with the same form; saving doesn’t send it back to approval. A panel with more than one series shows as “N series — edit them through the API”, and from the UI you can’t change its metrics or aggregation; you can change the other fields. To remove a panel, use the trash can on its row (“Remove panel”). A published dashboard can be deleted: it stops being visible to everyone, and the metrics and their history stay.
Approve a dashboard an agent proposed
Section titled “Approve a dashboard an agent proposed”An agent with the octopus-api MCP with write permission on its stage can list the environment’s metrics, read their points and propose a dashboard. The system skill octopus-observability explains how. What it proposes stays inert: it shows in a tab marked “proposed”, but isn’t published until an admin approves it. If the agent proposed it from a task, a pending approval is also added to that task, which appears in Inbox in the reader’s language.
-
Open the tab marked “proposed”. Above the panels you see who proposed it and how many panels it has.
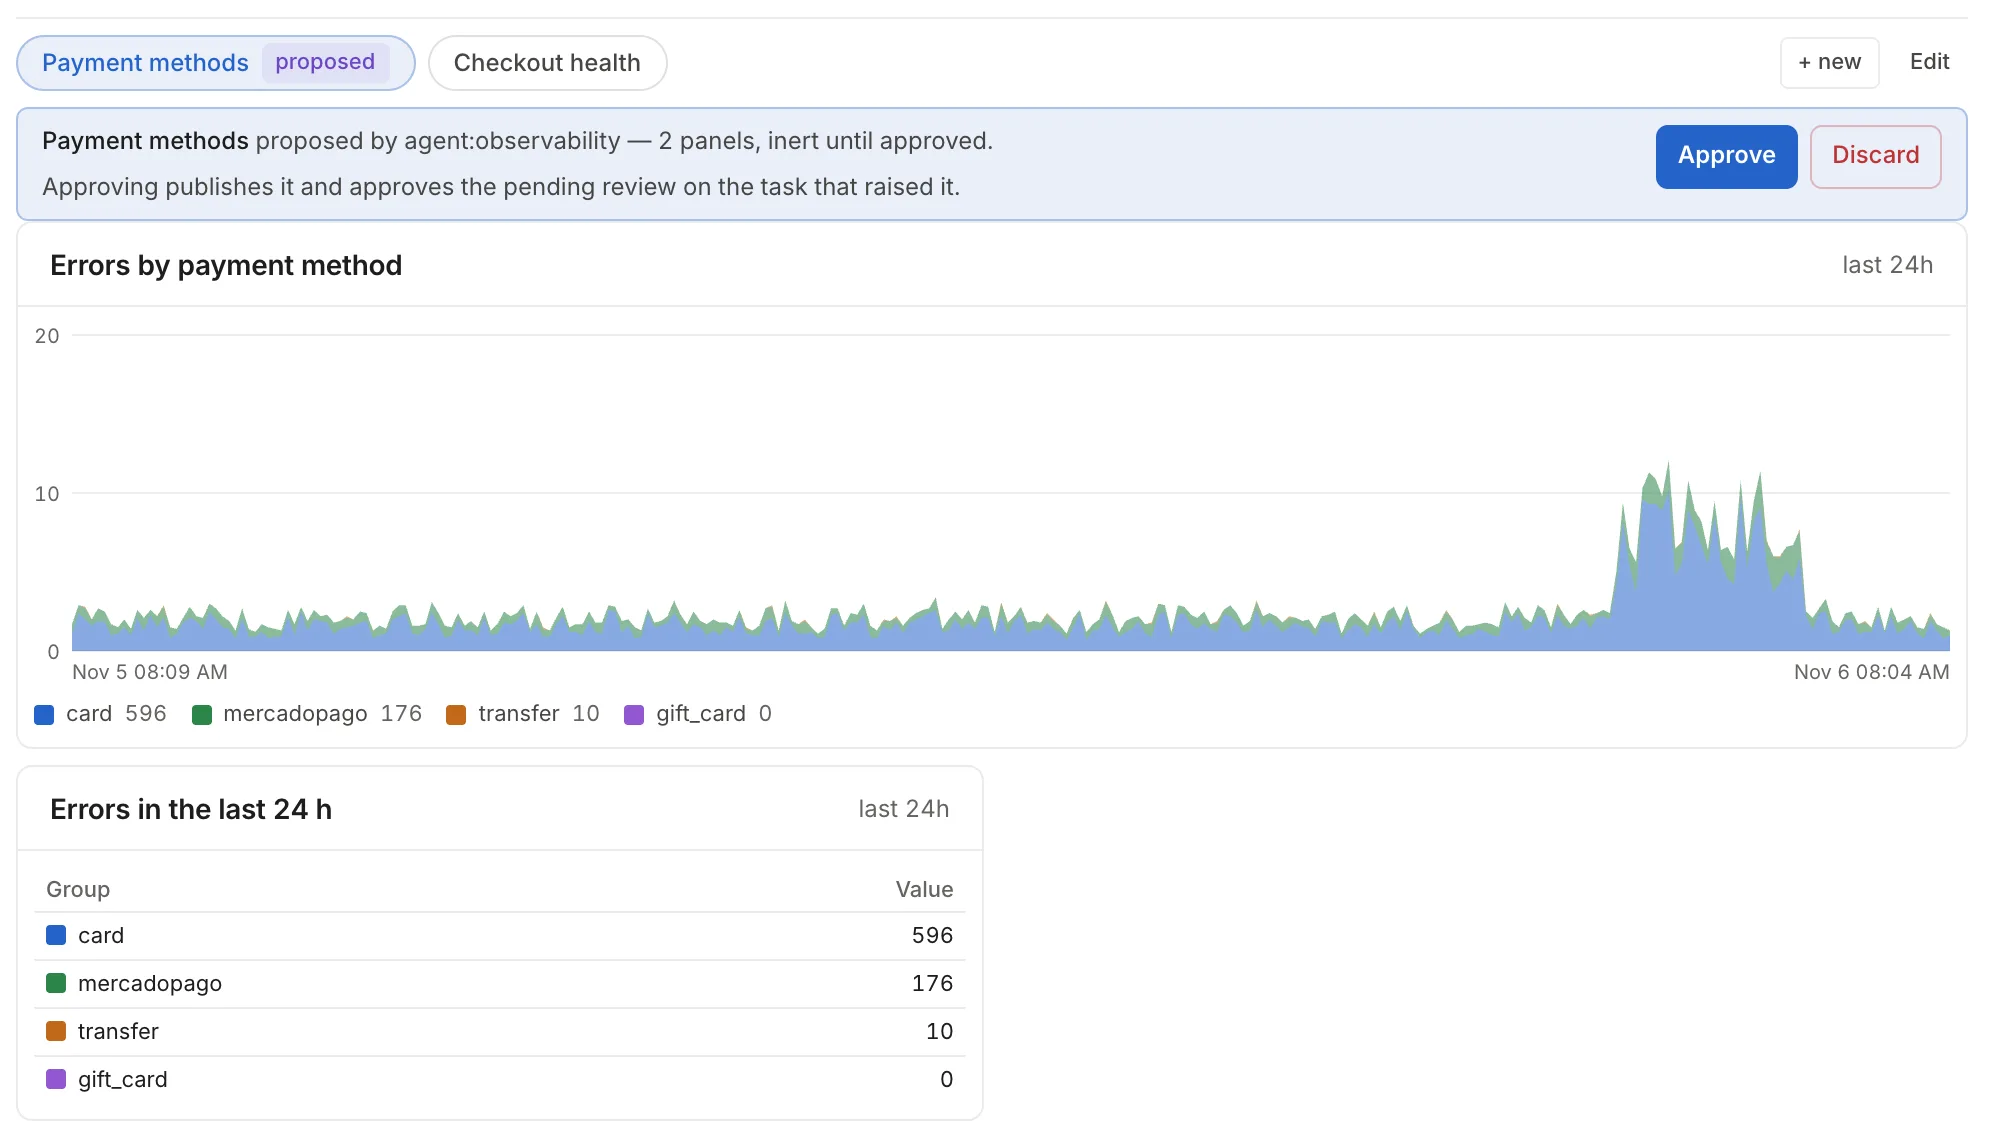
The panels already show real data, so you can see the result before approving it. -
Click “Approve” and confirm. If a dashboard with the same name was already published, it is archived. “Discard” asks for confirmation and deletes the proposed panels; the metrics and their data stay.
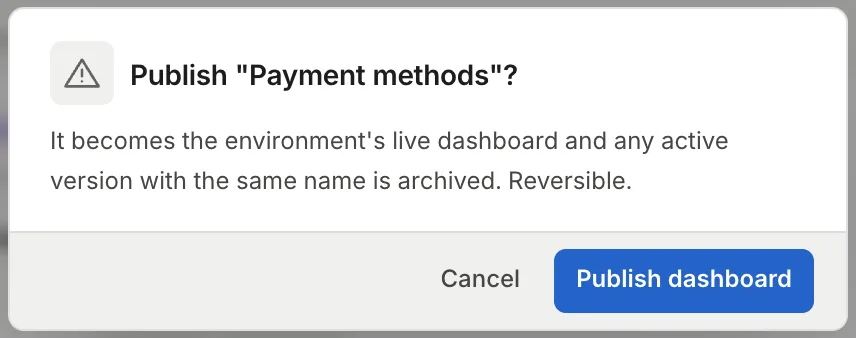
Approving the dashboard also approves the task's pending review.
Agents have no way to approve their own dashboards. How to give an agent the MCP with write access is in MCPs, and the system skills are in Skills.
Signals from the cloud
Section titled “Signals from the cloud”An environment’s fixed signals can also come from the cloud account instead of the app. For that, the environment needs an AWS or Google Cloud provider and a linked credential (“attach credential”); an agent proposes where each signal comes from (latency, errors, CPU, restarts, daily cost) and the proposal appears in the environment as “N mappings proposed” with “Approve”. Nothing is collected until you approve it. After that Thulu collects on its own, and the arrows icon (“Collect now”) forces a read.
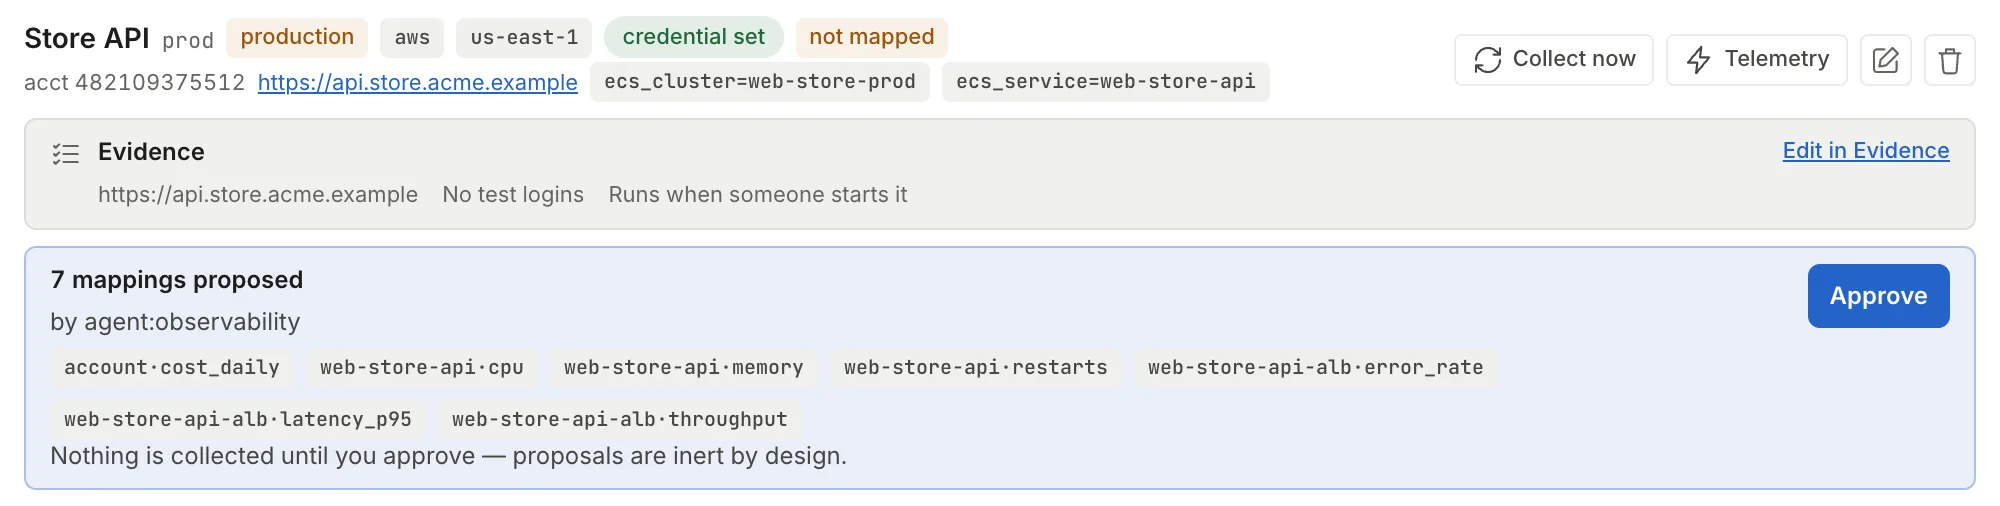
With the Prometheus or “Other” provider, Thulu collects nothing from outside: the signals fill in only with what the app sends over OTLP.
Prometheus for installation operators
Section titled “Prometheus for installation operators”The server publishes its own metrics at GET /metrics, in Prometheus format. Among them: HTTP requests and their duration, active sandboxes, tasks per board and stage (octopus_tasks_by_stage), agent runs by type and stop reason (octopus_agent_runs_total), tokens per model (octopus_tokens_consumed_total), cost per model (octopus_cost_usd_total), authentication events and environment metric reads, plus the standard Go process metrics.
There are two ways to read them:
- Set
OCTOPUS_METRICS_TOKENon the daemon and configure the scraper withAuthorization: Bearer <token>. - Without that variable,
/metricsanswers only to an admin of the operator workspace (OCTOPUS_OPERATOR_WORKSPACE), or to anyone in development mode.
These metrics cover the whole installation, not one workspace. The health checks are at /health, /health/live and /health/ready. The rest of the operation is in Self-hosted operations and the machine’s resources in Infrastructure.
Common problems
Section titled “Common problems”| What you see | Why | What to do |
|---|---|---|
| The Dashboards block asks you to approve a metric | No metric is approved | Approve at least one in “Custom metrics” |
| The app sends data but nothing appears | The endpoint points to another address, or the submission is rejected | Look at “Where data is coming from”: if the address shows up with rejected counts, check the token and the allowlist; if it doesn’t show up, check OTEL_EXPORTER_OTLP_ENDPOINT |
| A metric you send doesn’t appear | It is a histogram, or the environment already has 50 metrics | Send it as a counter or gauge, or delete metrics you don’t use |
| A counter panel is empty at first | A counter’s first value serves only as a baseline | Wait for the next submission |
| “Chart” doesn’t offer Stacked area, Bar or Table | The metric has no labels, or it is a gauge (Stacked area needs a counter) | Pick another metric or stay with “Line” or “Single number” |
A label shows other |
It went past 20 distinct values | Switch the label to one with fewer values |
| A Prometheus or “Other” environment shows no signals | Thulu doesn’t collect from those providers (the environment form warns about it) | Send traces over OTLP from the app |