

Usage and costs
Each time an agent finishes a run, Thulu stores a row with the engine, the model, the agent, the task, the project, the tokens (input, output, cache read and cache write), the turns, the duration, the stop reason and the cost. The “Usage” screen adds up those rows for a date range and splits them by engine, model, agent, project, tool, MCP server, skill and task.
The cost is the one the engine reports at the end of each session; Claude Code reports it. If an engine doesn’t report it, Thulu estimates it with the per-model price table and marks it with ≈ (the tooltip says how much is estimated). A model that isn’t in that table adds no cost, and the table marks it “no price”. The model provider bills you directly and Thulu doesn’t resell tokens, so the provider’s invoice is the reference.
Recommended flow: review the month’s spend
Section titled “Recommended flow: review the month’s spend”-
Open “Usage”. Click “Settings” at the very bottom of the sidebar, and in the bar that appears pick “Usage”, in the “Operations” group. You can also get there by clicking the “Cost · all time” card on the Dashboard.
-
Pick the range. The screen opens on the last 30 days; the “24h”, “7d”, “30d” and “90d” buttons change “From” and “To” at once, and you can also type the dates by hand. Everything recalculates as you change them, with no apply button.
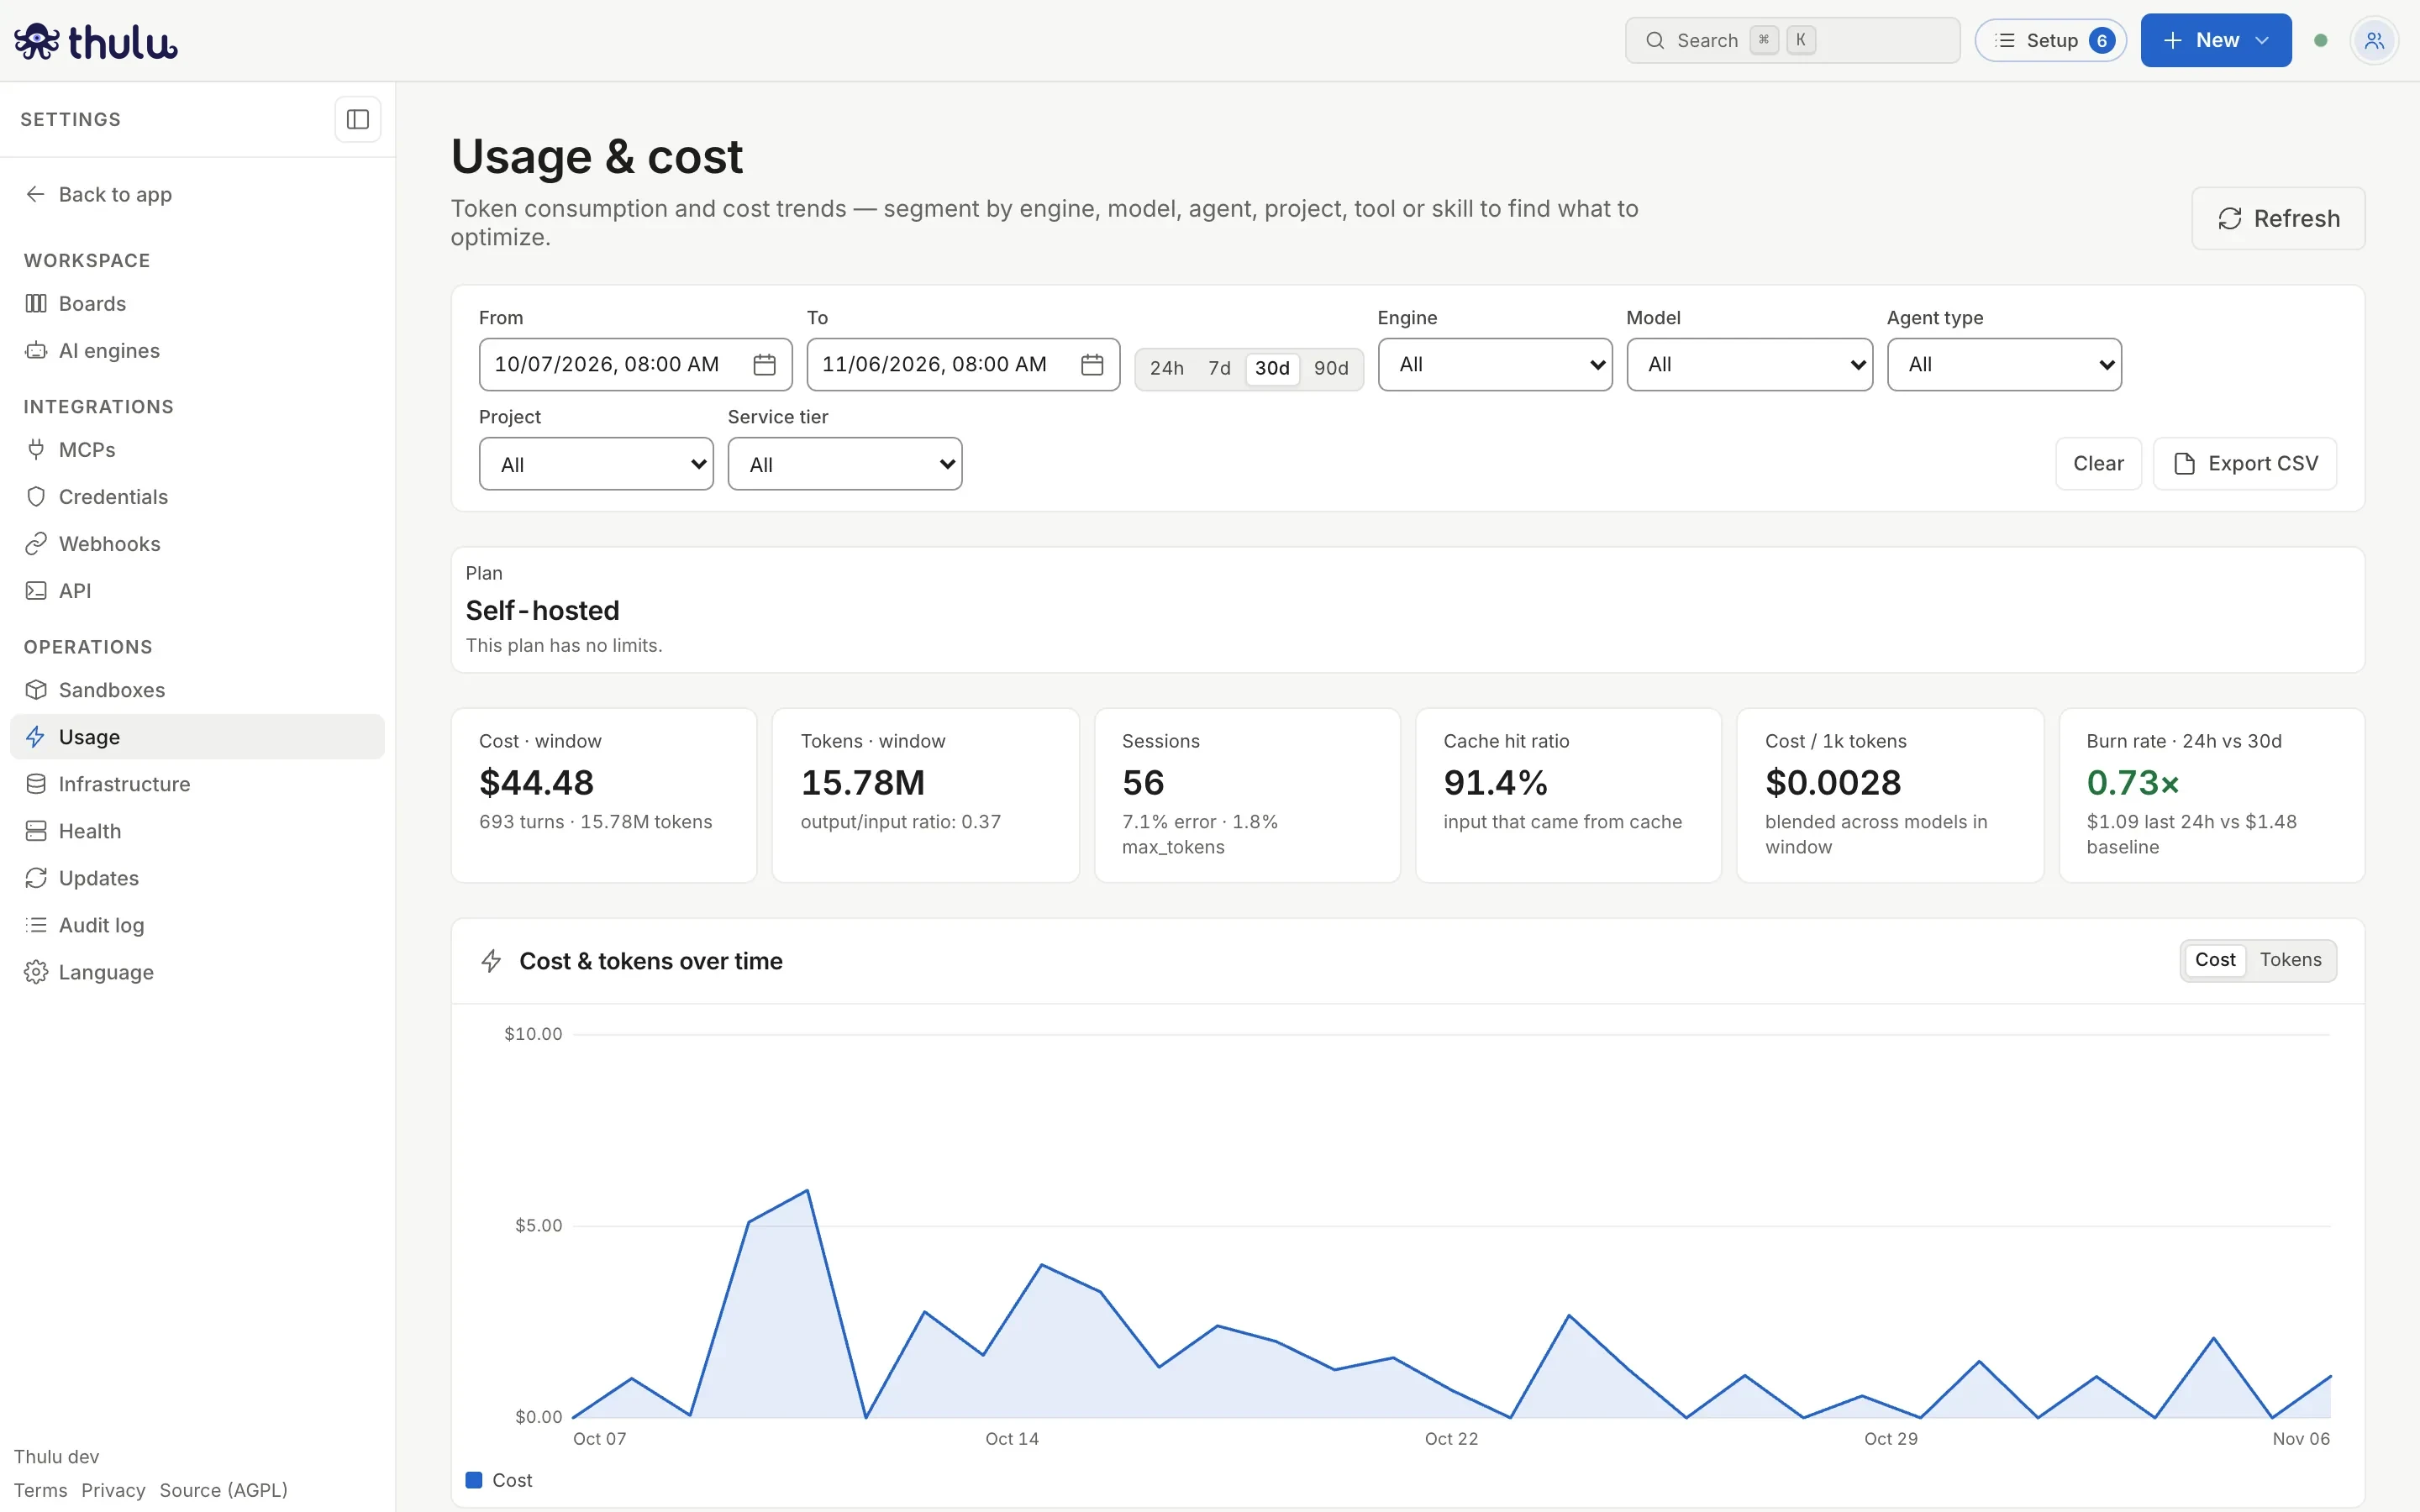
At the top: filters, the six cards for the period and the cost-per-day chart. -
Read the cards. “Cost · window” and “Tokens · window” are the totals; “Sessions” also says what percentage ended in an error or was cut off by
max_tokens. “Cache hit ratio” is the share of input that came from the model’s prompt cache. “Cost / 1k tokens” is the average across all the models in the period. “Burn rate · 24h vs 30d” compares what was spent in the last 24 hours with the daily average of the previous 30 days; it turns red above 1.4× and green below 0.8×. If there was no spend in those 30 days, it shows “—”. If the workspace has a plan with a quota, the “Plan” strip with “Runs this month” also appears at the top. -
See where it went. Below the chart are “By engine”, “By model”, “By agent type”, “By project”, “By tool”, “By skill” and “By MCP server”. Each row has a small bar with its share of the cost. “By tool” and “By MCP server” split only Claude Code runs.
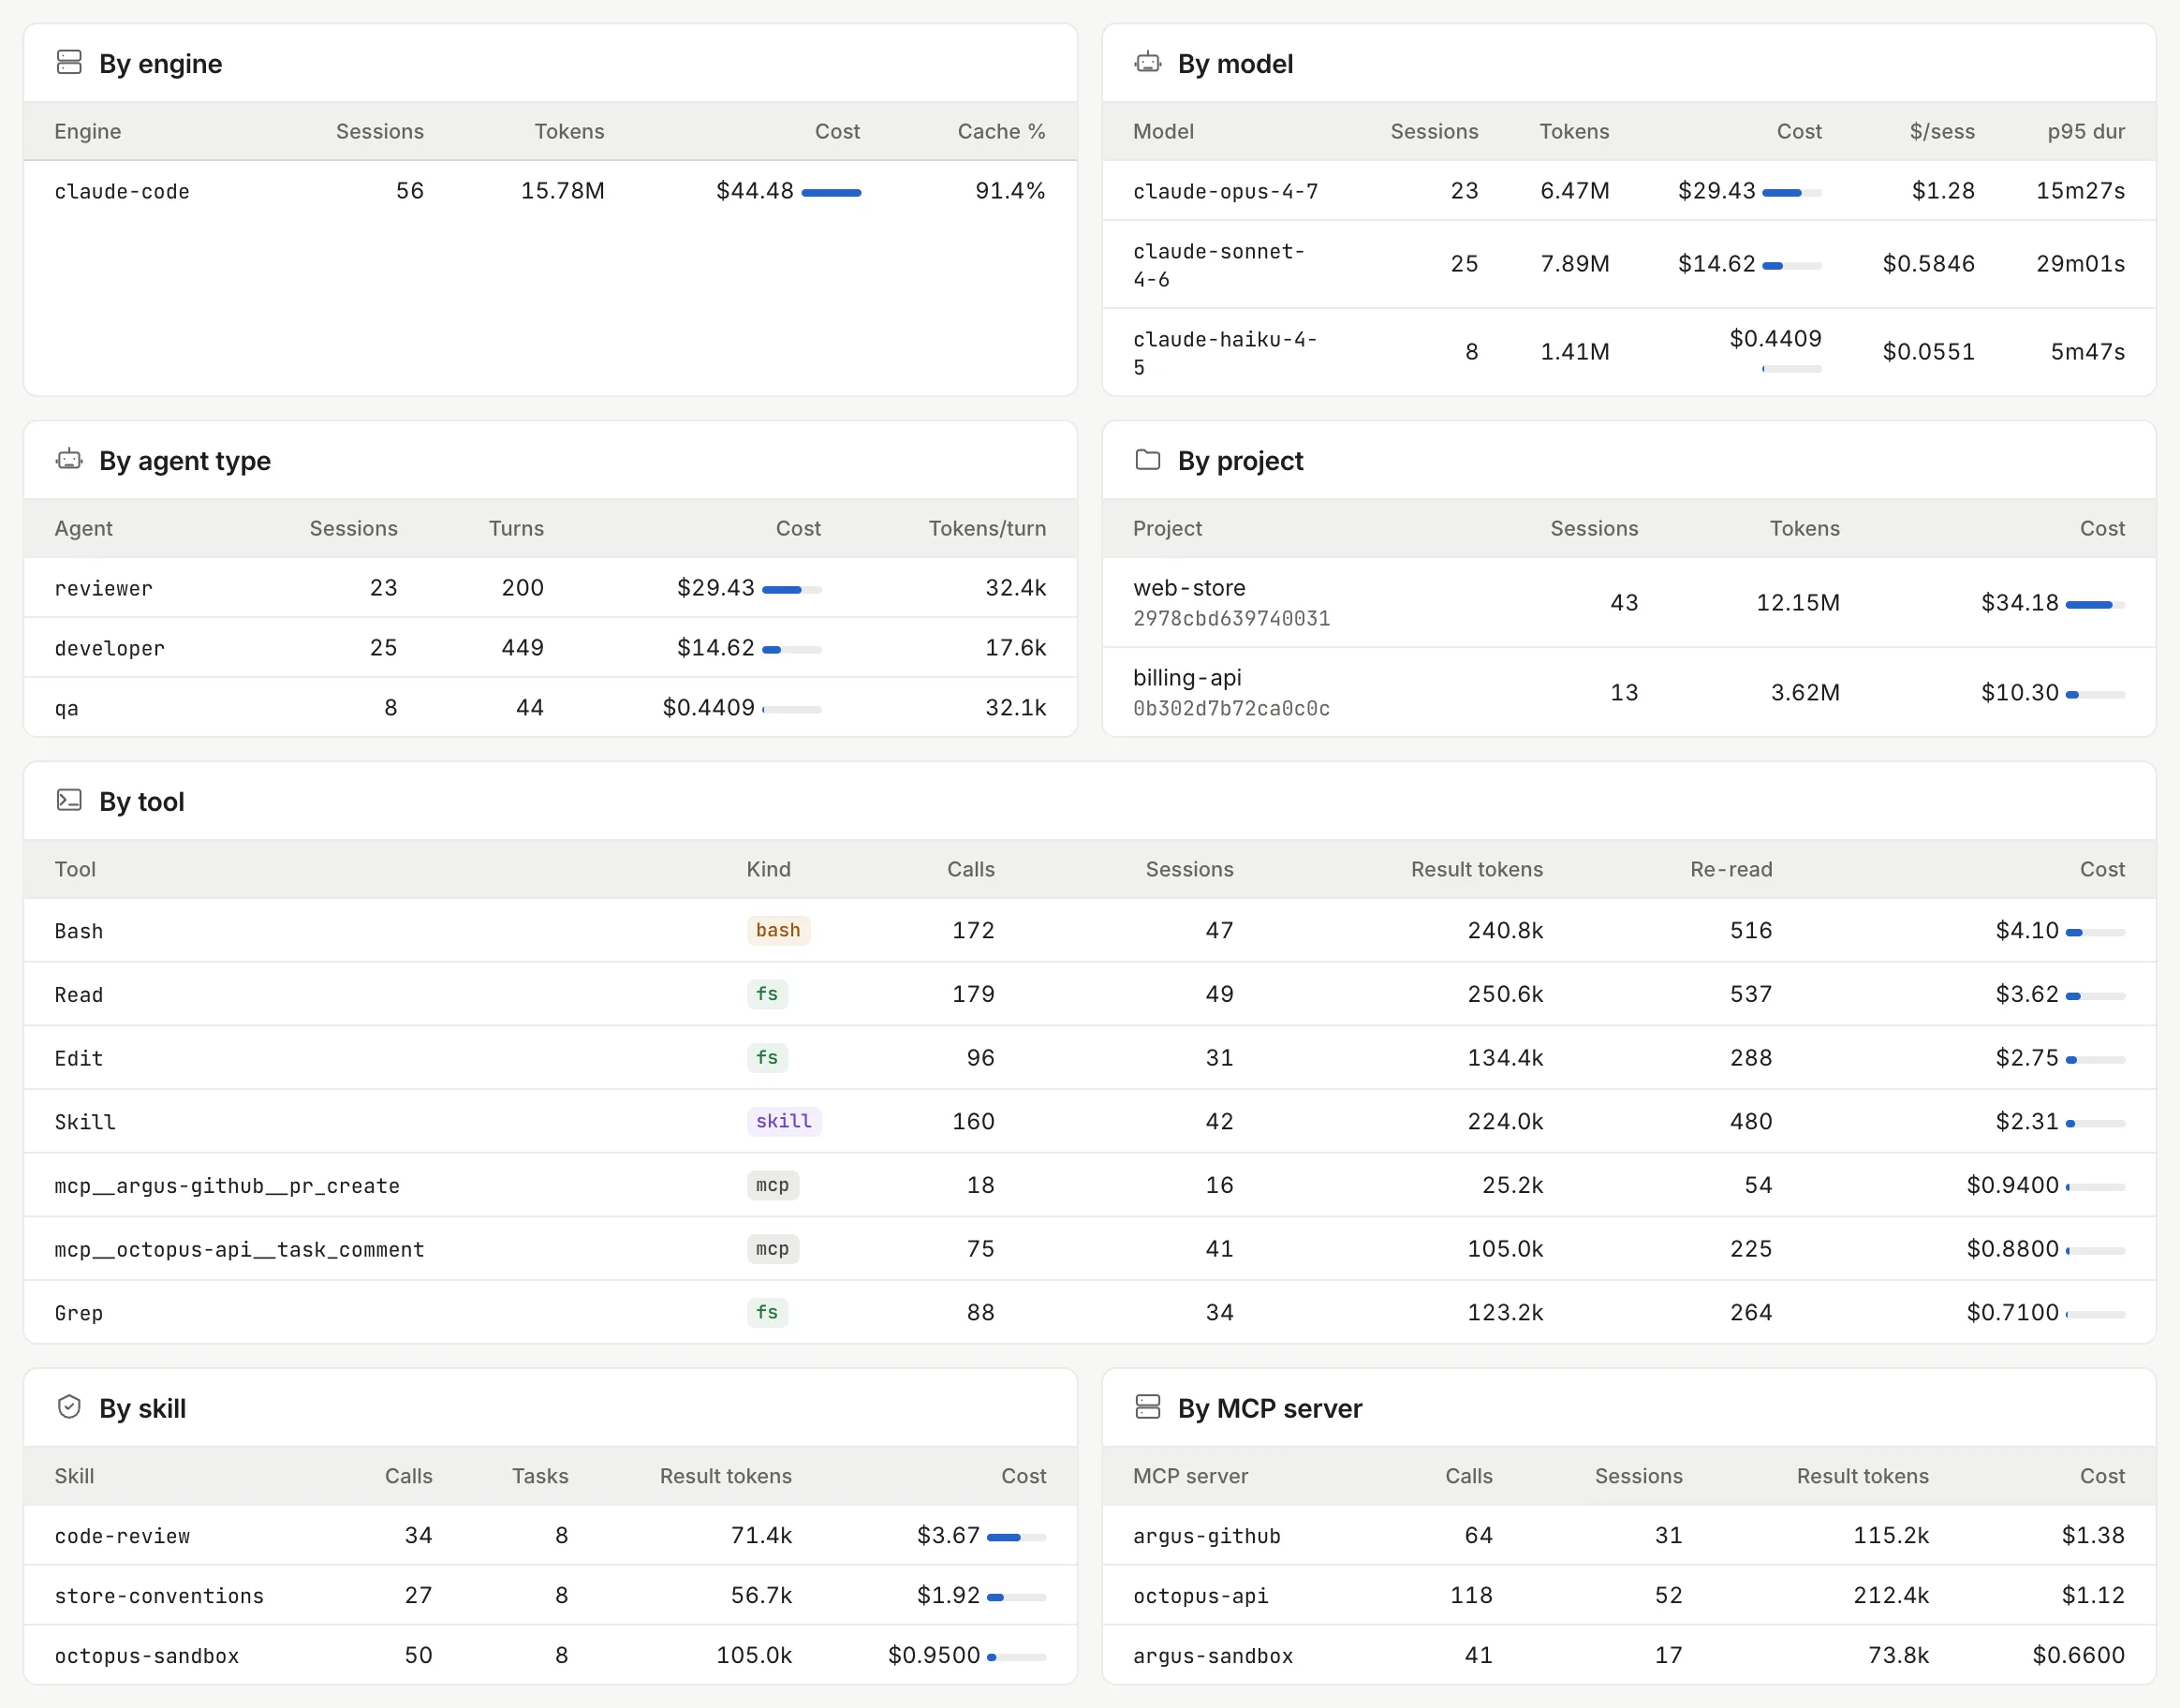
The reviewer on Opus spends the most: 23 sessions and $29.43 of the month's $44.48. -
If something stands out, filter. Pick a value in “Engine”, “Model”, “Agent type”, “Project” or “Service tier” and the whole screen, cards included, shows only that slice. The URL keeps the filters, so you can share the link. “Clear” goes back to 30 days with no filters.
-
Scroll down to “Top tasks by cost” and “Stop reason mix” to see which tasks concentrated the spend and how the sessions ended.
Find out how much a task cost
Section titled “Find out how much a task cost”The task shows, in its “Runs” property, how many runs it had, how many tokens they used and how much they cost, with ≈ if part of the cost is estimated. To compare tasks with each other, the “Top tasks by cost” table in Usage lists the 20 that spent the most in the chosen range, by title; the arrow on the right opens the task.
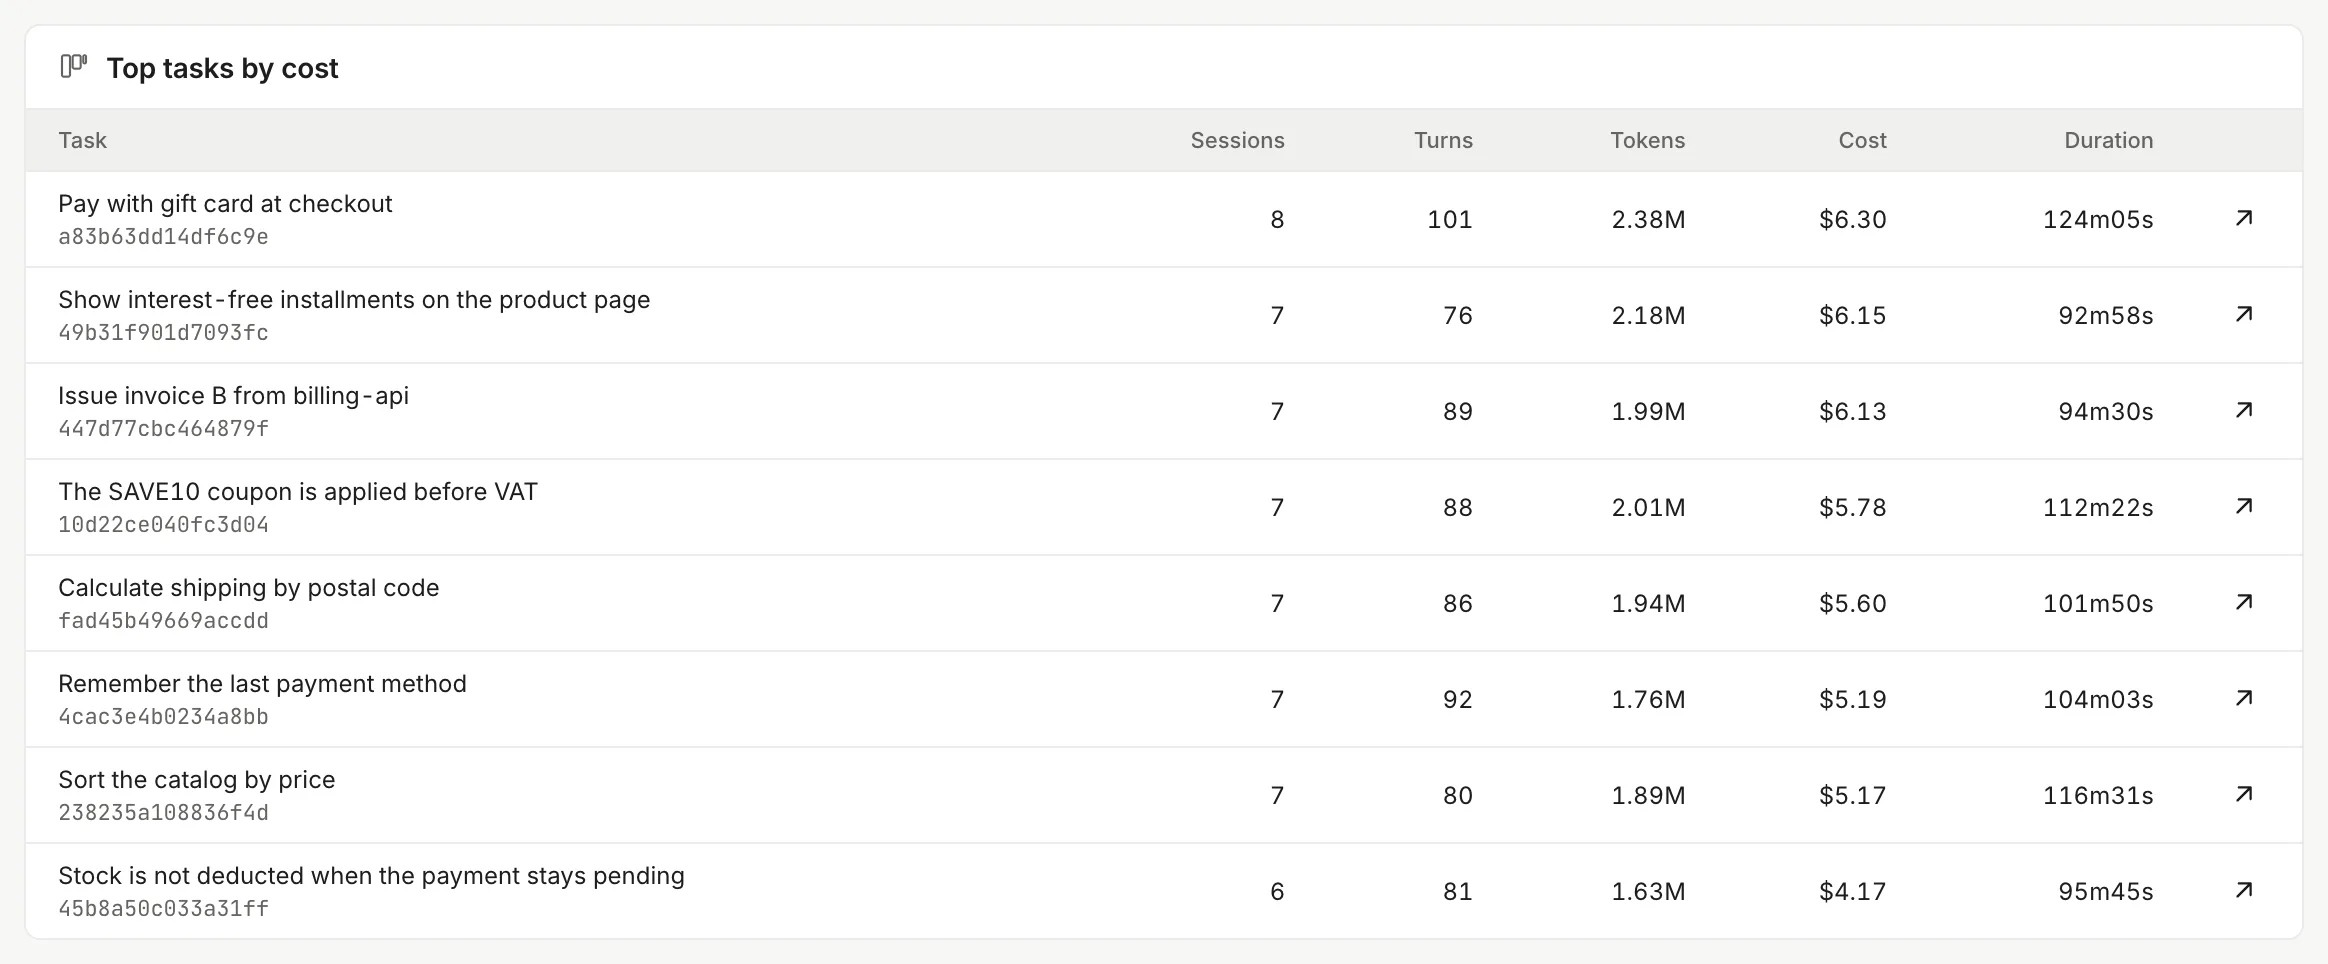
If you filter by project first, the table narrows to that project. Each project’s Overview has its own version of this table, next to the cost by stage and by model; it is explained in Metrics and dashboards.
Export to CSV
Section titled “Export to CSV”“Export CSV” downloads a file usage-<from>-<to>.csv with what you are looking at, filters included: one block per table (engine, model, agent, project, tool, skill and top tasks) with sessions, turns, tokens, cost and cache ratio (the tool and skill ones carry calls and share of cost). The chart and the cards are not in the file. If you click the button before the data finishes loading, a notice asks you to wait.
How to read each part
Section titled “How to read each part”| Part | What it shows |
|---|---|
| “Cost & tokens over time” | One line per day with the cost or the tokens; the “Cost” / “Tokens” selector switches the series. Hover to see each day’s value. |
| “By engine” | Sessions, tokens, cost and “Cache %” per engine (for example claude-code). |
| “By model” | The same per model, plus “$/sess” and “p95 dur”, the duration that only 5% of sessions exceed. |
| “By agent type” | Sessions, turns, cost and “Tokens/turn” per agent. It shows which agent is expensive by design and which by volume. |
| “By project” | Sessions, tokens and cost of the runs of tasks linked to each project. |
| “By tool” | How many times each tool was called (Bash, Read, the MCP ones) and a “Share of cost” that splits each session’s cost among its calls. The “Kind” groups them: fs, bash, mcp, skill, web. Claude Code runs only. |
| “By MCP server” | Calls and share of cost per MCP server. Claude Code runs only. |
| “By skill” | Calls and tasks per skill, with its share of cost. |
| “Top tasks by cost” | The 20 tasks with the highest cost in the range: sessions, turns, tokens, cost and duration. |
| “Stop reason mix” | How the sessions ended. end_turn is a normal ending; error_max_turns is an agent that ran out of turns; a lot of max_tokens means prompts that are too large. |

“Service tier” is the tier the model provider reports for each session (for example standard). If all your sessions use the same one, the filter has a single option.
Per-run rows are deleted after 90 days by default, and with them the tables, the cards and “Top tasks by cost” for that period. The per-day chart and the Dashboard’s “Cost · all time” come from a daily summary that is not deleted. Whoever administers the installation controls the window; see Settings.
Usage on the Dashboard
Section titled “Usage on the Dashboard”The Dashboard repeats a short version of these numbers: the “Cost · all time” card, which adds up all the spend from the daily summary, and the “Usage” block below it, with tokens, output, total cost, average per session, sessions and turns.

The Dashboard and Usage count tokens differently, and each labels it: “tok without cache” on the Dashboard is input plus output; “Tokens · window” in Usage also adds cache reads and writes. To compare periods, use Usage.
Usage limits
Section titled “Usage limits”The limits come from the model provider and from the workspace’s plan. None of them is configured from this screen.
Model provider limit
Section titled “Model provider limit”The Dashboard’s “Rate limit” card shows what percentage of your account’s limit with the provider is used, when the engine reports it during a run: “plenty of room” below 60%, “warming up” up to 85% and “near limit” above that. It is the last reported value and is lost if the server restarts.
If the engine hasn’t reported anything yet, the card says “—” with “no data from the engine”.
Plan monthly quota
Section titled “Plan monthly quota”On the SaaS version each workspace has a plan with a cap on agent runs per calendar month (UTC): 100 on Free, 1000 on Team, 5000 on Business and no cap on Enterprise. A self-hosted installation has no cap. “Runs this month”, on the Dashboard and in the “Plan” strip of Usage, shows how many you have used. When the quota runs out, the run doesn’t launch and the task gets a system comment saying how many runs the plan includes and when it renews. Each plan also limits how many agents run at once (1 on Free, 5 on Team, 15 on Business): runs beyond that cap wait in the queue until a slot frees up. The plans are explained in SaaS.
The turn limit of each run is set per agent and per stage; it is in Agents.
Common problems
Section titled “Common problems”| What you see | Why | What to do |
|---|---|---|
| A run that just finished doesn’t show up | “To” stayed fixed at the time you opened the screen, and “Refresh” doesn’t move it | Click a preset again (“30d”) or reload the page |
| “Burn rate” says 0.00× | There were no runs in the last 24 hours | That is correct. The rate always looks at the last 24 h, not the chosen range |
| A cost has ≈ | The engine didn’t report the cost of those sessions and Thulu estimated it with the price table | Take the provider’s invoice as the source of truth for that engine |
| A session says “no price” | The model isn’t in the price table: its tokens add no cost | Take the provider’s invoice as the reference |
| “By tool” is empty | The runs in the range aren’t Claude Code | That is correct: this split exists only for Claude Code |
| “Couldn’t load filter options” | Reading the recent sessions failed | The filters stay on “All”; reload the page |
Usage shows your workspace’s spend. Whoever operates the installation also sees the machine’s resources in Infrastructure and can read the cost of all workspaces through Prometheus, as described in Metrics and dashboards.